Social Media Competitor Analysis and Benchmarking: A Step-by-Step Guide

Are your competitors getting reach, engagement or visibility on social media and do you know why? A social media competitor analysis helps you understand how your brand compares, uncover what’s working in your industry, and identify opportunities to improve your own strategy.
In this article, we´ll walk you through a proven step-by-step process, the tools you need, and best practices to turn competitor insights into real growth.
What is Social Media Competitor Analysis?
To begin, let’s explain what exactly a social media competitor analysis is and why you should consider doing it. At its core, social media competitor analysis is the process of finding out:
- How your social media performance compares to your competitors across key metrics.
- What factors are driving your success or limiting your results?
- Which actionable strategies you can apply to improve your performance.
Social media competitor analysis is often confused with simple benchmarking, but benchmarking is only one part of the overall process.
Benchmarking:
Social media competitor benchmarking focuses specifically on where you stand by comparing metrics such as engagement rate, follower growth, or posting frequency. It’s commonly used to establish performance baselines and set realistic goals. For example, an average engagement rate of 1% may appear strong on its own, but benchmarking shows whether that figure is above or below industry or competitor averages.
Competitor analysis:
True competitor analysis goes further. It helps you identify your strengths and weaknesses in relation to your competitors and understand the reasons behind performance differences. The goal isn’t comparison for its own sake, but using these insights to actively improve your social media strategy.

How to Do a Social Media Competitor Analysis and Benchmarking Evaluation
Starting a social media competitor analysis can feel overwhelming, especially when you’re not sure where to begin. To simplify the process, we’ve created a 7-step social media competitor analysis template you can follow. Since effective competitor analysis relies on data, it’s also important to use a powerful social media analytics tool. For our example, we’ll use Fanpage Karma, an all-in-one platform that offers unlimited profile tracking. All tables, charts, and visualizations shown below were generated using this tool.
To demonstrate how to do a social media competitor analysis, we’ll use a real-world case study analyzing major streaming brands such as Amazon Prime, Apple TV, Disney+, HBO Max, Netflix, Paramount+, and Peacock. We’ll compare their social media performance, explain what drives stronger results, and highlight opportunities for improvement across platforms.
- Identify Your Competitors
- Choose the Platforms You Are Interested In
- Determine Important Metrics for Benchmarking and Analysis
- Conduct Social Media Competitor Benchmarking Analysis
- Analyze Your Data for Optimization Insights
- Implement Your Findings in Your Social Media Strategy
- Monitor Your (and Your Competitors’) Progress

Step 1: Identify your Competitors
The first and most important step in conducting your social media competitor analysis is to identify the competitors you are adding to your analysis. In other words, you need to define what businesses (or individuals) are comparable to yours in terms of the content they publish, geographic location, company or brand size and the scale and maturity of their social media presence. It is important to find profiles that are similar to yours in these areas so your analysis can focus on profiles that are most likely to give you meaningful insights.
Before starting your analysis, you need to clearly define which competitors actually make sense to compare. This ensures your insights are relevant and actionable.
- Decide whether you want to compare your brand locally, nationally, or globally.
- Get a clear picture of how large your market is and how many rivals are operating within it.
- Use social media tools to discover relevant profiles if you don’t already know all competitors in your space.
It is also important for businesses who are interested in competitor analysis for social media, to make sure that you are tracking profiles of companies or businesses that share your own target audience:
- They should offer similar products or services.
- They should operate in comparable locations or markets.
- Their company size and social media reach should be relatively similar to yours.
For our example analysis, we have identified 7 streaming companies that would be direct competitors in the streaming industry. Of course, there are some differences between them, namely their reach into international markets outside the US. However, they are also offering similar services and have a focus on more or less the same geographic markets, especially the US market.

Step 2: Choose the Platforms you are Interested In
When talking about how to do an effective social media competitor analysis, it is important to specify that there are real differences between various social media networks, both in terms of the type of content that is posted as well as overall content strategies businesses use for each platform.
For example, the streaming brands in our case study may target different audience segments on Instagram than they do on TikTok or Facebook. Many businesses intentionally adapt their content strategy based on the platform, meaning success on one network doesn’t automatically translate to another.
Because of this, competitor analysis on social media should always start at the platform level:
- Analyze competitors separately for each social network
- Compare performance only within the same platform (e.g. Instagram vs. Instagram)
- Avoid combining all social media metrics into one overall comparison too early
Looking at platforms individually allows you to set accurate benchmarks and understand what works where. Later in the process, you can bring insights together across networks to identify broader trends and strategic opportunities.
Once you’ve selected your competitors and the social networks you want to analyze, all profiles should be organized in a social media dashboard. At this point, profile limits become an important consideration. For example, 20 competitors across 5 social networks = 100 profiles to track.
Many tools limit the number of profiles you can analyze, which can restrict your insights or require additional costs. Using a tool that supports unlimited profile tracking ensures you can analyze each platform properly without compromising your process.
Step 3: Determine Important Metrics for Benchmarking and Analysis
Before selecting metrics for your social media competitor analysis, it’s important to clarify the goals behind your social media strategy. Are you primarily focused on increasing reach and followers, driving more interactions and engagement, or improving performance across all of these areas?
Because most social media strategies serve multiple objectives, choosing the right metrics is essential. Not only for competitor analysis, but also for measuring overall performance and social media ROI.
There are three key factors you need to consider when choosing metrics:
- Understand what each metric actually measures
Social media metrics can vary by platform, and the same metric name may be calculated differently depending on the network or the social media tool you use. For example, engagement may include different types of interactions across platforms. Understanding these differences ensures you’re comparing data accurately. - Consider data availability across platforms
Not all metrics are available for competitor analysis on every social network. Some platforms provide detailed competitive data, while others offer more limited insights. Data availability also depends on the social media tool you’re using, as tools may differ in which metrics they support for social media benchmarking. - Align metrics with your strategic goals
Most importantly, the metrics you track should directly support your objectives. If your primary goal is to increase brandawareness, you should focus on metrics such as reach, impressions, and follower growth, as these indicate how many users are seeing and discovering your content. If engagement is your main priority, metrics like interactions, engagement rate, and video views are more relevant since they show how actively audiences respond to your content. For content optimization, analyzing post types, posting frequency, and performance by format can help you understand which content resonates most and how to refine your strategy.
Ultimately, there’s no single set of “right” metrics. What matters is that you understand what each metric represents, how it’s measured, and how it connects to your broader social media goals.
Step 4: Conduct Social Media Competitor Benchmarking Analysis
After identifying the competitors to monitor, selecting the social platforms to review, and defining the key metrics, you can begin benchmarking and analysis, following a structured process that applies to almost any business goal.
It’s best to start with an overall social media benchmarking analysis. This gives you a clear picture of how your profiles compare to competitors across key metrics. As discussed earlier, benchmarking should always be conducted separately for each social media platform to ensure accurate and meaningful comparisons.
A practical first step is creating metric tables and charts for each network you’re analyzing such as Facebook, Instagram, TikTok or YouTube. These tables and charts provide a structured overview of performance and make it easy to see how profiles compare at a glance. Below is an example of individual metric tables for Facebook profiles.
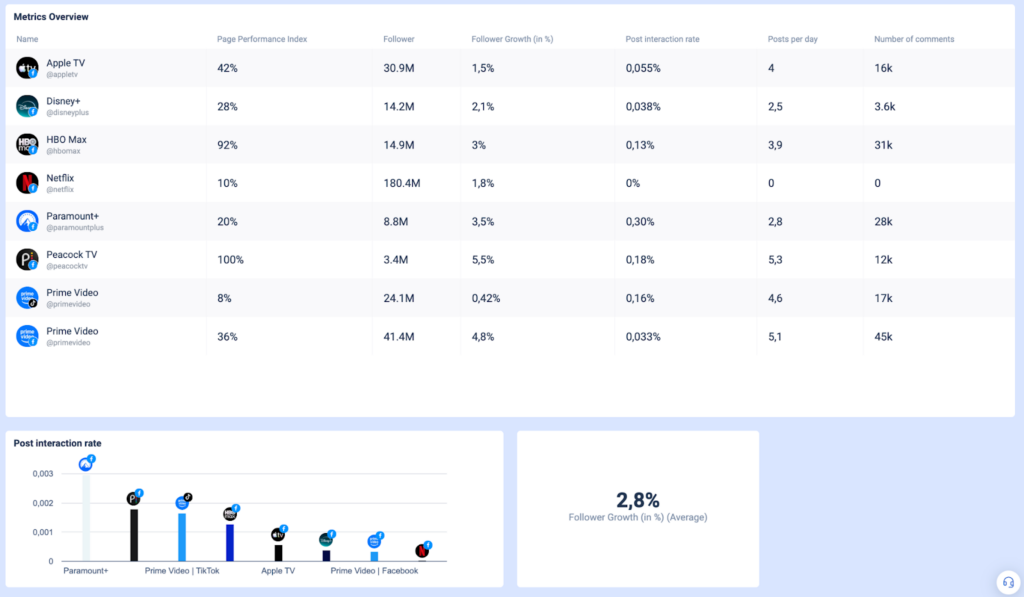
At the top, a detailed metrics overview table displays KPIs including Page Performance Index, total followers, follower growth rate, post interaction rate, posts per day, and number of comments. Below the table, individual visualizations highlight specific metrics, such as a bar chart comparing post interaction rates across platforms and a separate box showing the average follower growth rate.
Social media benchmarking tables like these help identify performance gaps and reveal where improvements are needed across key KPIs. By focusing on individual metrics using different chart formats, as shown in the illustration above, you can get deeper insights into the most important metrics.
While this analysis can be repeated for every social media network included in your study, the underlying approach remains the same. One important consideration is the time period of the data. The examples shown here are based on the last 28 days (collected in January 2026). Since results can vary significantly depending on the timeframe, always ensure you understand which period your data represents and adjust it as needed for your analysis goals.
Step 5: Analyze your Data for Optimization Insights
After you have done your social media benchmarking analysis, you can move on to your content optimization analysis. Competitor analysis for social media involves studying your competitor’s data and identifying patterns that stand out. For example, you might notice that a competitor achieves higher engagement rates despite posting less frequently, gains followers faster when running video campaigns, receives significantly more comments on certain content formats like behind-the-scenes posts, or sees spikes in interaction when posting at specific times of day. You could also compare how different platforms perform for each competitor, such as stronger interaction rates on TikTok but lower growth on Facebook, to uncover strategic opportunities for your own channels.
Remember, the size of your data set matters, so having a tool with the ability to analyze an unlimited number of competitor profiles can make a big difference. Below, we will highlight a few different types of content optimization analyses you can do. Social media competitor analysis can include looking at:
- Successful Content Formats
- Post Metrics
- Video Performance
- Best Times to Post
- Top Hashtags
- Tagging Analysis
- Sentiment Analysis
1. Successful Content Formats
When deciding which content formats to post, competitor analysis is one of the fastest ways to make the choice evidence-based. On Instagram, for example, you often need to decide whether pictures, carousels, or reels are most likely to drive a high post interaction rate. Rather than relying only on your own profile’s results (which can be influenced by small sample sizes or recent campaigns), you can expand your dataset by pulling performance data from competitors and industry peers. This gives you a broader, more reliable view of what actually works in your niche.
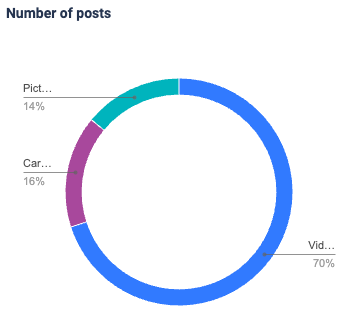
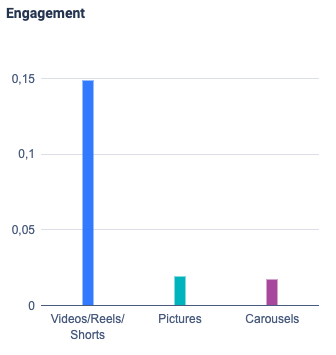
These graphics show which content formats competitors prioritize and which ones actually drive the highest engagement. By combining posting volume and performance data, you can clearly identify what works best and adjust your own content strategy based on proven competitor results rather than assumptions.
2. Post metrics
Choosing the right content formats is important, but it’s just as critical to analyze individual posts across multiple metrics. By creating post-level metric tables and filtering for the metrics most relevant to your goals, you can see exactly which posts perform best and understand why, allowing you to identify clear patterns and replicate successful elements rather than relying only on averages.
You can see an example of this below relating to the TikTok posts across the various profiles we are tracking. In this table, the following post-level metrics provide a more detailed view of performance:
- Number of likes – shows how many users positively reacted to the post
- Number of comments – indicates how strongly the post encourages conversation
- Reactions, comments, and shares – reflects total interaction volume across key engagement types
- Post interaction rate – measures engagement relative to reach or impressions
- Interactions per impression/view – shows how efficiently each view is converted into interactions
- Average video length – helps identify whether video duration influences performance
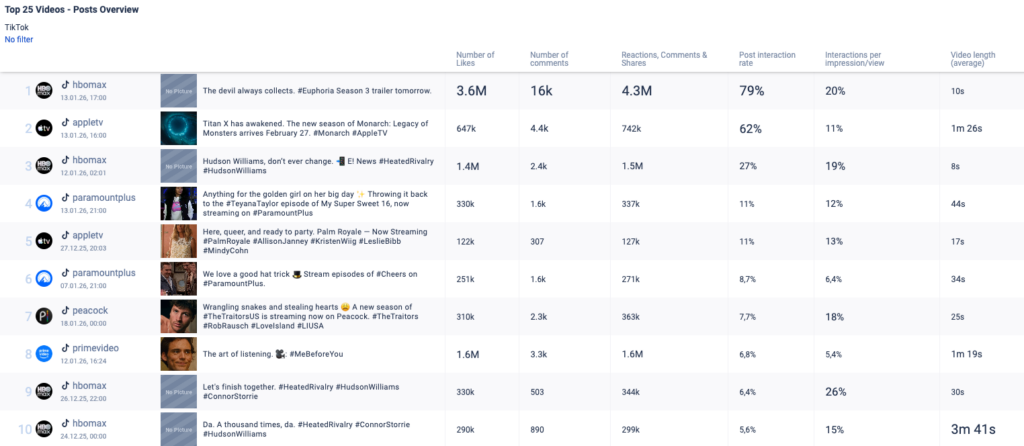
These tables can be customized by social media platforms and tailored to the specific insights you want to focus on, ensuring the analysis aligns with your goals.
3. Video Performance
Since videos, Reels, and Shorts are becoming increasingly important across social media platforms, it’s no longer enough to look at engagement in general. To fully understand what works, you should also analyze how video length influences performance. By examining which video durations generate the most likes, comments, or interactions, you can identify optimal lengths that keep viewers engaged without losing attention. These insights help you fine-tune your video strategy, create more effective content, and align your production efforts with what audiences actually respond to.
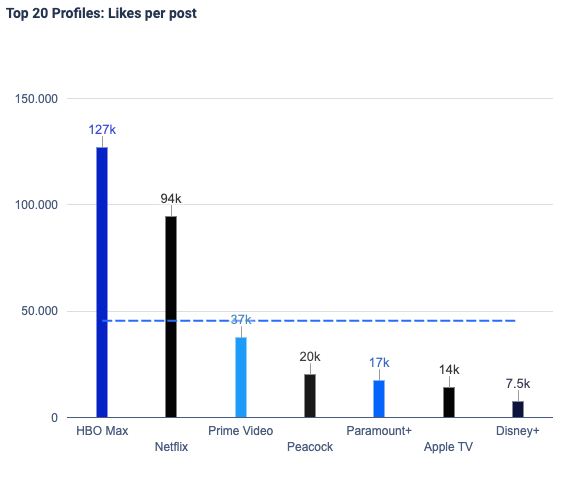
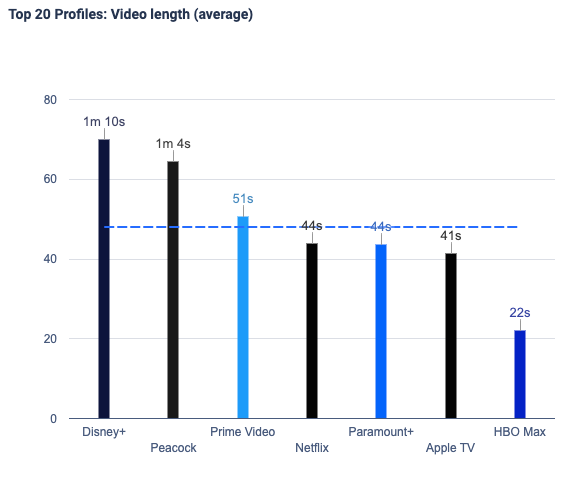
In the example below, we analyzed TikTok video length in relation to likes per post across the tracked profiles. The charts show that shorter videos tend to perform better:
- HBO Max achieves the highest average likes per post with the shortest average video length
- Profiles with longer videos, such as Disney+ and Peacock, receive fewer likes on average.
This suggests that, on TikTok, more concise videos may be more effective at driving engagement, highlighting the importance of optimizing video length based on competitor performance data.
When combined with post-level metric tables, these insights give you a clear overview of what works and what doesn’t, allowing you to refine, optimize, and continuously improve your social media strategy based on real performance data.
4. Best Times to Post
Once you’ve analyzed content performance and engagement to understand audience behavior, the next step is to examine when posts perform best. We have covered the entire process of finding the best time to post on social media before, but we should mention here that you can use the data compiled in your data set to find out what times of the day correspond to higher post interaction rates. Below, we show the best times to post on Instagram for the profiles in our study.
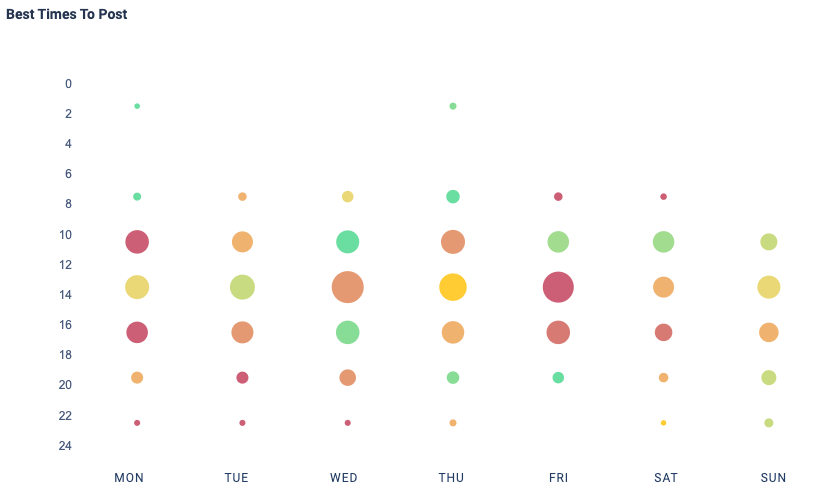
In this chart, the size of each dot represents how frequently posts were published at a specific time, while the color indicates engagement performance, with greener dots reflecting higher interaction rates. When analyzing this data, it’s especially valuable to look for smaller green dots. These time slots signal high audience engagement but relatively low posting activity from competitors, making them strong opportunities to stand out.
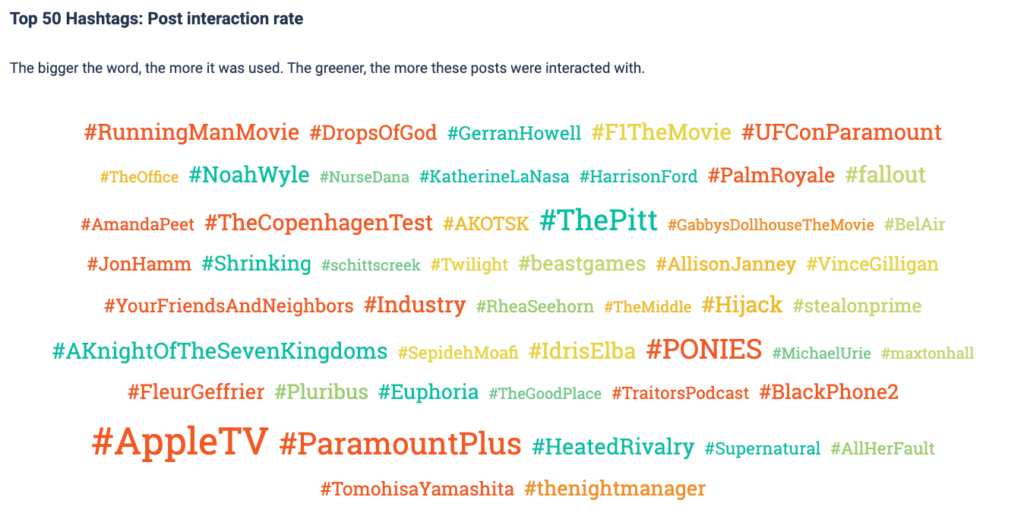
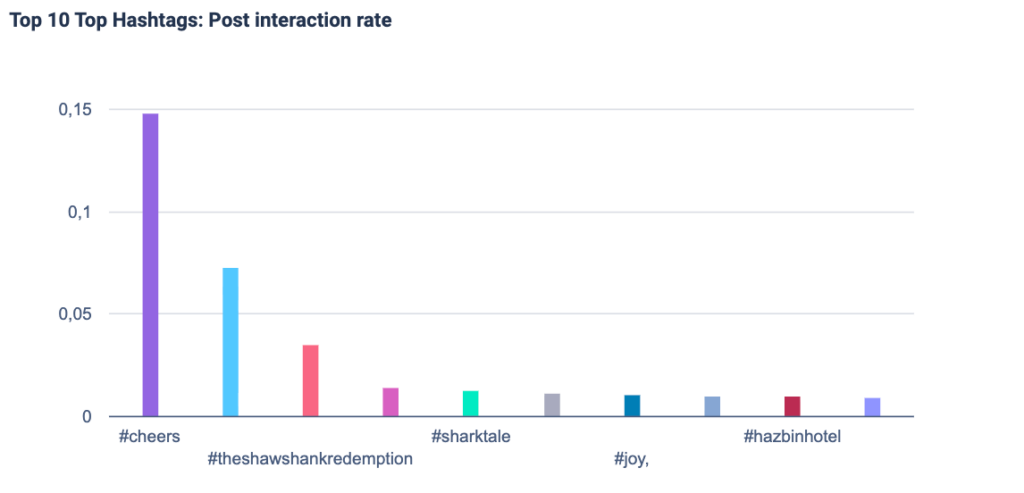
5. Top Hashtags
Another helpful step is identifying which hashtags you should use. A social media competitor analysis helps you determine which hashtags are worth considering by showing which ones your competitors use most frequently and which perform best in terms of post interaction rate. This can be done through data-driven hashtag research or by analyzing the top 10 hashtags your competitors use most often.
It’s also important to analyze your data across different timeframes. Depending on your goals, you can:
- Review aggregated data from the past year to identify long-term trends
- Focus on specific weeks or months for more granular insights
- Use month-over-month comparisons to see how individual profiles have improved or declined over time
One of the keys to a successful social media competitor analysis is examining performance across multiple time periods and metrics to gain a well-rounded understanding.
6. Tagging Analysis
We should also mention a tagging analysis as part of the social media competitor analysis process. A tagging analysis helps you better understand correlations between various metrics and what appears in the content of posts.
With a tagging analysis you can label each post from your own account and from your competitors with specific characteristics you are interested in. The goal is not to categorize posts but to analyze how these tags correlate with specific performance metrics such as likes or interactions in general. Try not to focus on minor details, but rather on broader characteristics that consistently apply across multiple competitors.
To get a better understanding, let’s take a look at how a tagging analysis works in practice. In the example below, we tagged Instagram posts across the tracked profiles by their tone: informative, humorous, emotional, neutral, inspirational and provocative.
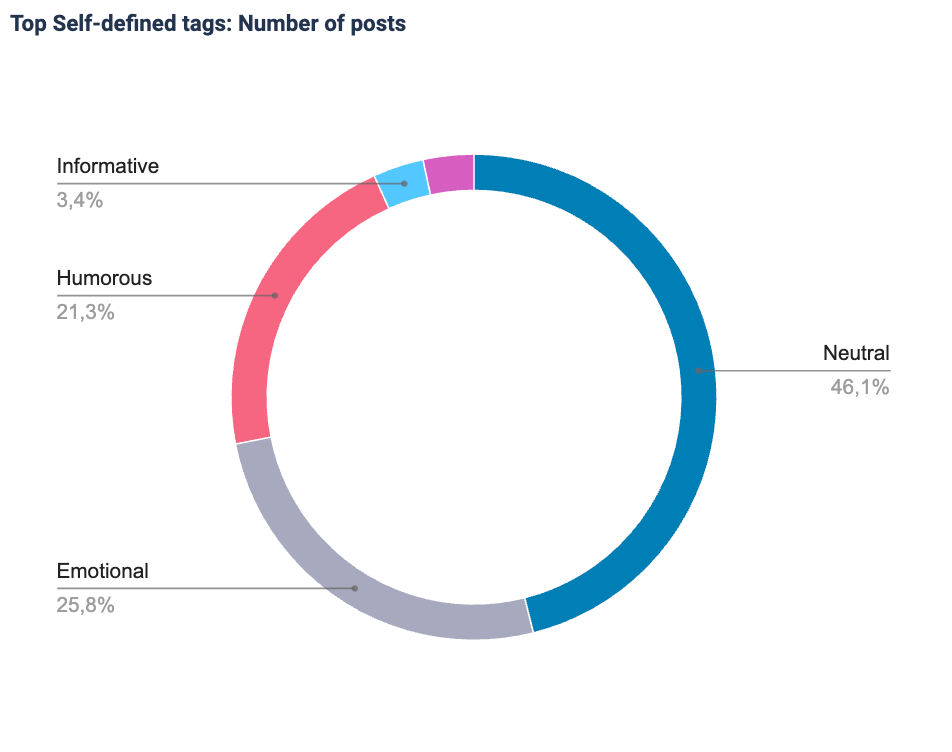
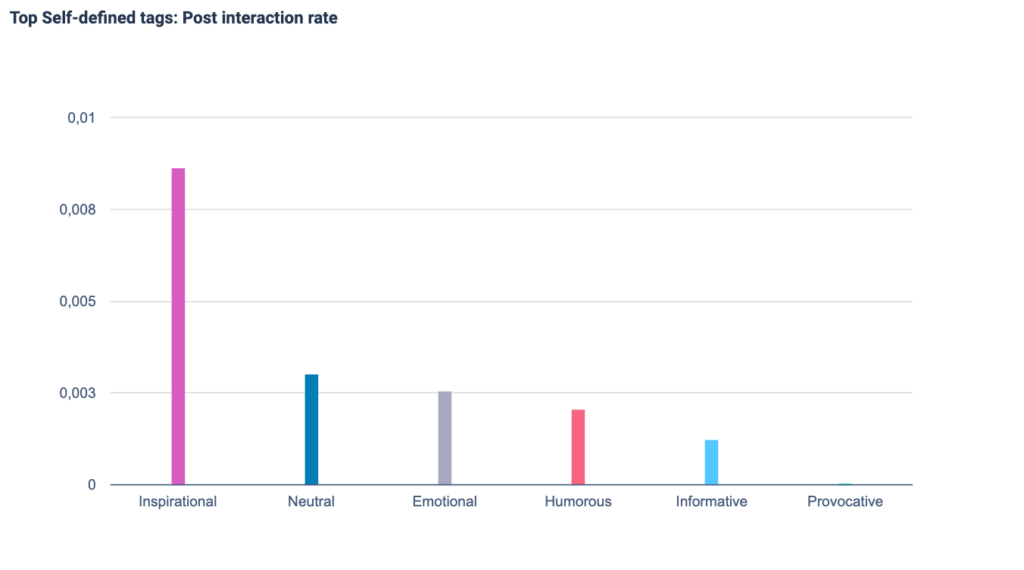
The chart on the right illustrates the number of posts per tone, whereas the chart on the left highlights the interaction rate for each tone. Together, they reveal clear differences between content usage and performance:
- Neutral content dominates the content mix and accounts for the largest share of published posts.
- Emotional and humorous tones are also used frequently, while informative and provocative posts appear only occasionally.
- Inspirational content achieves the highest interaction rate, despite being used less often.
- Neutral and emotional posts perform at a moderate level in terms of interaction.
- Humorous, informative, and provocative tones generate comparatively lower engagement.
These insights suggest that adjusting the content mix toward higher-performing tones can help increase overall interaction. This example clearly shows how a well-defined tagging analysis turns content data into actionable insights by making performance patterns easier to compare and interpret.
7. Sentiment Analysis
One last competitor analysis technique that we will mention is perhaps something that a lot of people don’t think of: sentiment analysis. Understanding the sentiment or broad opinions around posts can be a helpful tool to see if your competitors are posting content that motivates feelings of one kind.
Sentiment analysis can be done in a few different ways and visualized through graphs or tables. It generally breaks down posts into three categories:
- Positive – posts that express approval, satisfaction, or enthusiasm and often correlate with higher engagement or brand affinity
- Neutral – factual or descriptive posts without a clear emotional tone, typically used for information sharing
- Negative – posts that convey criticism, dissatisfaction, or frustration and may indicate potential issues or risks
This can be a great way to understand opinions of your competitors’ brands and content.

Step 6: Implement Your Findings in Your Social Media Strategy
Social media competitor analysis and benchmarking is a great way to see how you compare to competitors and improve performance. But once you identify areas for improvement, the key is to implement those insights by integrating them into your actual social media content. To keep the process manageable, consider using a focused 30-day sprint so it doesn’t feel overwhelming:
Week 1: Competitor Research + Benchmark Setup
- Identify your top 3-5 main competitors on social media.
- Choose the platforms you want to focus on (e.g., Instagram, TikTok, Facebook).
- Define the most important metrics to track (engagement rate, reach, follower growth, interaction rate).
- Run a first competitor benchmarking analysis to understand what performs best in your niche.
- Set clear goals and establish a baseline so you can measure improvement over the next few weeks.
Week 2: Content Optimization + Posting Strategy
- Review competitor posting formats (reels, images, carousels, stories) and spot patterns.
- Use your findings to adjust your own content mix (e.g., post more images if they perform better).
- Conduct a best times to post study based on engagement data.
- Start a realistic, consistent posting cadence (e.g. 3–4 posts per week).
- Set up a scheduling tool to plan content ahead.
Week 3: Engagement + Growth Actions
- Actively engage with your community by replying to comments and DMs quickly.
- Start one simple engagement routine (e.g. daily 10–15 minutes of interaction).
- Test at least one collaboration opportunity (collab post, shout-out, Story mention, Live)
- Track whether engagement routines increase interaction rates compared to Week 1
Week 4: Analyze Results + Plan Next Steps
- Review performance data across all key metrics and compare it to your initial benchmark.
- Identify your top-performing posts and note what worked best (format, timing, topic).
- Refine your content strategy based on insights from competitor and audience behavior.
- Build a repeatable reporting and optimization process for the next month.
- Create your next 30-day content plan using what you learned.
Step 7: Monitor Your (and Your Competitors’) Progress
The 30-day sprint is a great starting point for building an effective social media strategy, but the work doesn’t stop there. Even after completing your competitor analysis on your social media and implementing improvements, it’s important to keep monitoring both your performance and your competitors over time. There are a few key reasons why this is the case:
- Benchmarking Is an Ongoing Process
Social media benchmarking results are not static, so even if you improve, you should still monitor whether your competitors are advancing even faster. - Trends Change—So Should Your Analysis
Trends on social media are constantly shifting, and what works today may not work tomorrow. Regular competitor analysis on social media helps you stay aligned with evolving audience preferences and emerging content formats.
Wrapping Up: Social Media Competitor Analysis
As we have discussed above, if you want to do effective competitive analysis on social media, you need to have a process and use an advanced social media tool. Knowing who your competitors are and what you want to get out of your social media competitor analysis are key first steps. Social media benchmarking allows you to see how your profile compares to that of your competitors and helps you in setting your own goals. The different types of content analyses that you can perform with the right social media tool then can start discovering areas where you can improve. Importantly, you need to implement what you have found and continue to monitor your progress as you go.
If you’d like a quick, practical example of what this kind of analysis can look like in action, check out our free AI-powered benchmarking report, which summarizes key competitive insights, content trends, and performance benchmarks in an easy-to-digest format or use our free 14-day trial offer from Fanpage Karma. This social media tool is industry-leading not only because of the powerful benchmarking and content analysis features, but also because it offers unlimited profile tracking. It also comes with community management, publishing, and research features.
You can also participate in one of the free weekly webinars that Fanpage Karma offers to learn more about the tool.

Do Instagram Posts With Text Overlays Perform Better?

How Long Should TikTok Videos Be?

What Is Dark Social and How Can It Be Measured?

The Best Social Media Audit Tools
The Secrets of Organic Success on Facebook