Your Guide To Instagram Competitor Analysis

Instagram is one of the most popular platforms for creators, influencers, and social media managers thanks to its massive audience and highly visual content formats. But focusing only on your own posts cannot be enough. To build an effective strategy, you need to understand what already works in your niche, what doesn’t, and why.
And that is exactly what Instagram competitor analysis allows you to do. By analyzing how similar accounts perform, you can identify which content decisions consistently lead them to stronger results, which strategies underperform for them, and which patterns are worth replicating or avoiding. Instead of relying on trial and error, competitor analysis lets you learn directly from the successes and mistakes of others who target the same audience.
With the right data and social media tool, anyone can run a clear Instagram profile analysis, study engagement patterns, and understand what drives performance in their niche. That is why, in this guide, we will show you how to analyze an Instagram account step by step and what to look for when choosing the best tool for Instagram analytics, so you can base your decisions on real insights instead of guesswork.
The Steps to Conduct Instagram Competitor Analysis
We will now present the process of analyzing competitor accounts on Instagram that will be helpful for those just starting to grow their following, as well as those who manage established accounts already. Each step represents a building block to using various analytical and data-based approaches that help your actual performance. The main parts of the Instagram competitor analysis include:
- Identifying Your Instagram Competitors
- Setting Up Your Data Sets
- Creating a Benchmarking Report
- Undertaking Content Optimization Analyses
- Applying What You Learned

Step 1: Identify your Instagram Competitors
Before starting your Instagram competitor analysis, you need to know exactly who your Instagram competitors are. In this context, “competitors” are not just brands offering similar products or services but any profiles competing for the same audience you want to reach. These can include:
- Businesses in the same niche
- Influencers targeting the same audience
- Creators covering similar topics
- Community or interest pages your audience also follows
Knowing how to find your competitors on Instagram is essential because competitor analysis ultimately means audience analysis. By studying the profiles that speak to the same audience you want to attract, you can gain insights into what types of content this audience responds to and which formats, topics, and angles consistently perform well. This is not just about understanding who you already reach or who follows you, but about defining who you want to speak to and learning how others successfully capture that audience’s attention.
Building an extensive list of competitor profiles gives you more data points for your analysis, which improves the quality of your analysis. A stronger dataset makes it easier to:
1) Identify trends and recurring patterns,
2) Benchmark performance accurately,
3) Discover content optimization opportunities.
Ultimately, the quality of your insights depends on the quality of your competitor list. The more relevant your competitor selection, the more accurate and actionable your findings will be.
Step 2: Setting Up an Instagram Competitor Analysis Data Set
Once you identify your competitors, it is time to add them to your tracking dashboard. In general, the more relevant profiles you track, the better your insights, because a larger dataset gives you stronger, more reliable patterns.
Choosing the right timeframe is also essential because different timeframes can lead to different results. This is why the best Instagram competitor analysis tools offer unlimited profile tracking and access to historical data.
1. Choose the Right Timeframe (This is where your results can change)
Your timeframe doesn’t just filter the data. It can completely change the story your analysis tells:
- Short timeframes (e.g., 2 to 4 weeks) are great for spotting recent shifts such as a new content format, a campaign push, a sudden engagement spike, or algorithm-driven changes. You get a precise overview of what’s happening right now.
- Longer periods (e.g., 6 to 12 months) are better for identifying reliable benchmarks and repeatable patterns such as seasonality, consistent posting cadence, typical engagement ranges, and long-term growth trajectories.
In practice, most analyses work best when you use both: a longer timeframe to establish the baseline and a shorter one to understand what’s changing right now.
Keep in mind that your competitor list and your timeframe define your dataset, and your dataset determines whether your insights are accurate and actionable.
2. Define Clear Goals Before You Start
Before you dive into the data, get specific about what you actually want to learn. Simply saying that you want to learn what your competitors are doing is generally not enough. Your goals determine which competitors you include, which metrics you focus on, and which timeframe makes sense. In other words, clear goals help you avoid collecting a lot of data that does not lead to clear decisions.
Most likely, you will want to do a combination of many things, but it is essential that you ask yourself what matters most to achieving your goals. In order to help you get started, we have outlined 3 core questions to ask yourself when beginning the competitor analysis process.
Question 1: How do I calculate accurate benchmarks for growth or engagement?
This means defining what “good” looks like in your niche by tracking concrete KPIs such as:
- Follower count and follower growth rate (%) to understand how fast similar profiles are growing.
- Post interaction rate to benchmark how much interaction competitors generate relative to their audience size.
- Average Likes per post to see what level of visibility and appreciation is realistic in your segment.
- Posting frequency (posts per day) to understand how often competitors publish to maintain performance.
Question 2: How do I identify top-performing content themes across competitors?
This helps you identify what your shared audience consistently responds to, not just what works for one brand or one viral post. Use competitor data to identify:
- Topics that repeatedly outperform others within your niche.
- Content ideas that deliver reliable results across multiple profiles, not just one viral post.
- Content formats that work best for specific content between your competitors (e.g., reels for product launches, carousels for content formats, stories for behind-the-scenes)
Question 3: How should I look for content optimization insights from competitors?
This objective focuses on actionable improvements you can apply directly to your content strategy, such as:
- Which content formats (Reels, Carousels, images) drive the highest post interaction rates in my niche.
- How posting frequency correlates with interaction and growth among my competitors.
- Which types of posts generate more likes, comments, or shares.
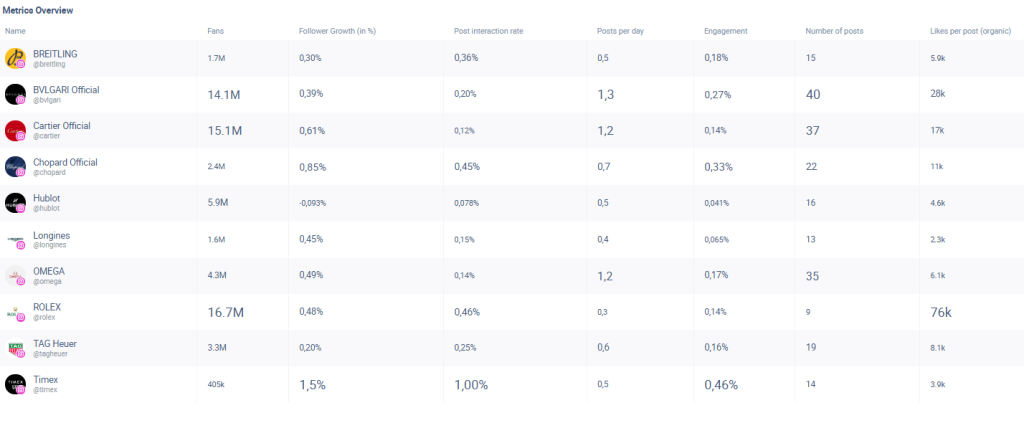
The answers to these questions will help you focus on what is truly important for your competitor analysis. It is then time to get into the real “analysis” part of your competitor analysis. This will focus on what type of analyses are most important and how to do them. To help illustrate the entire process, the examples below will represent a competitor analysis on real brands. In this case, we will analyze 10 major watch brands on Instagram: BREITLING, BVLGARI, Cartier, Chopard, Hublot, Longines, OMEGA, ROLEX, TAG Heuer, and Timex. Using this dataset, we will show how to run practical benchmarking and content optimization analyses with a social media analysis tool.
Step 3: Creating a Benchmarking Report
Once your data set is ready, you can begin your benchmarking analysis. This step helps you understand how your profile compares to similar accounts and where you stand in your niche. To start, choose the key metrics you want to evaluate. A strong Instagram profile analysis tool should let you select from dozens of metrics and track enough profiles to make your insights meaningful.
Choose the Metrics that Matter: An effective Instagram profile analysis compares competitors across multiple performance indicators. Common metrics include:
- Follower count
- Follower growth rate
- Competitors’ engagement rate on Instagram
- Post-interaction rate
- Posting frequency
- Average likes per post
Filtering these metrics gives you a clear view of which profiles perform best and where your own account sits in comparison. After selecting your metrics, a benchmarking table like the one below helps you understand how each competitor performs across key indicators. This overview highlights strengths, weaknesses, and outliers at a glance.
Benchmarks also show you what strong performance looks like in your industry and help you define realistic targets. Because these benchmarks are calculated using data from multiple profiles that target the same audience, they provide a far more accurate reference than isolated metrics from a single account. Instead of guessing whether your engagement or growth is “good,” you can compare your results against an industry-specific baseline built from many data points. For example:
- If your goal is to improve engagement, you can use the average competitors’ engagement rate on Instagram as a benchmark. This shows the level of interaction that comparable profiles are realistically achieving.
- If you want clearer growth expectations, you can analyze the average follower growth rate within your segment to understand what sustainable growth looks like in your niche.
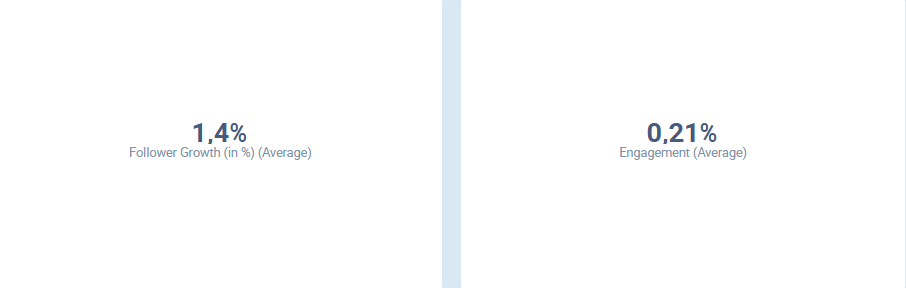
With the right benchmarking tool, these calculations are quick and can be adjusted to the specific timeframe you’re interested in, such as quarterly or seasonal periods. Below we see a calculation of the average follower growth rate and engagement rate for the profiles in our data set for Summer 2024 (June, July, August), creating a concrete performance reference for that period.
Beyond single benchmarks, competitor analysis also allows you to:
- Compare multiple KPIs side by side to understand the relationship between growth and engagement.
- Track performance trends over time instead of relying on one-off snapshots.
- Identify competitors that are improving faster than others and investigate what has changed in their strategy.
The most important point is to keep monitoring your competitors. Tracking their progress closely over time can help you see who might be improving their performance and who is falling behind. This can give you clues about what profiles you want to pay special attention to going forward.
Step 4: Undertaking Content Optimization Analyses
Once you have completed your benchmarking analysis, the next step is to analyze your competitors’ profiles to better understand WHY these accounts are successful. Mostly, you probably want to know what you can be doing better to improve your own performance.
The answer is to conduct content optimization analyses that use data-based approaches. You may initially be searching for some sort of Instagram analyzer tool that gives you insight into private accounts. While there are helpful tools that exist that can give you an overview of your performance and some initial tips based on what other similar accounts are doing, conducting data-based content optimization analyses is what will really help you find optimization potentials.
With a social media analytics tool, you can analyze what your competitors on Instagram are doing and discover what aspects of their strategy are working well for them.
There are different options in terms of finding content optimization potentials from your competitor analysis process. Below, we outline some of the most effective, data-driven content optimization approaches to understand which content decisions generate engagement across your competitors in your niche:
1. Find the best times to post
The first approach is to conduct a best time to post analysis to find out which time frames correlate with higher interaction rates. This is important because Instagram’s algorithm rewards early engagement on posts. The faster users interact with your post after it’s published, the more likely the algorithm will show it to other users.
This analysis becomes far more powerful in an Instagram competitor analysis context. Instead of relying on your own posting data, you analyze the historical performance data from multiple competitor profiles that target the same audience. This increases the number of data points for your analysis and reduces the risk of relying on isolated trends.
Another important point to stress is that the profiles you bring into your analysis should not only be focused on a similar industry or content niche, but also post in relatively similar time zones. The goal of finding the best times to post for your competitors is to understand when your audience and similar ones are most likely to interact with your content.
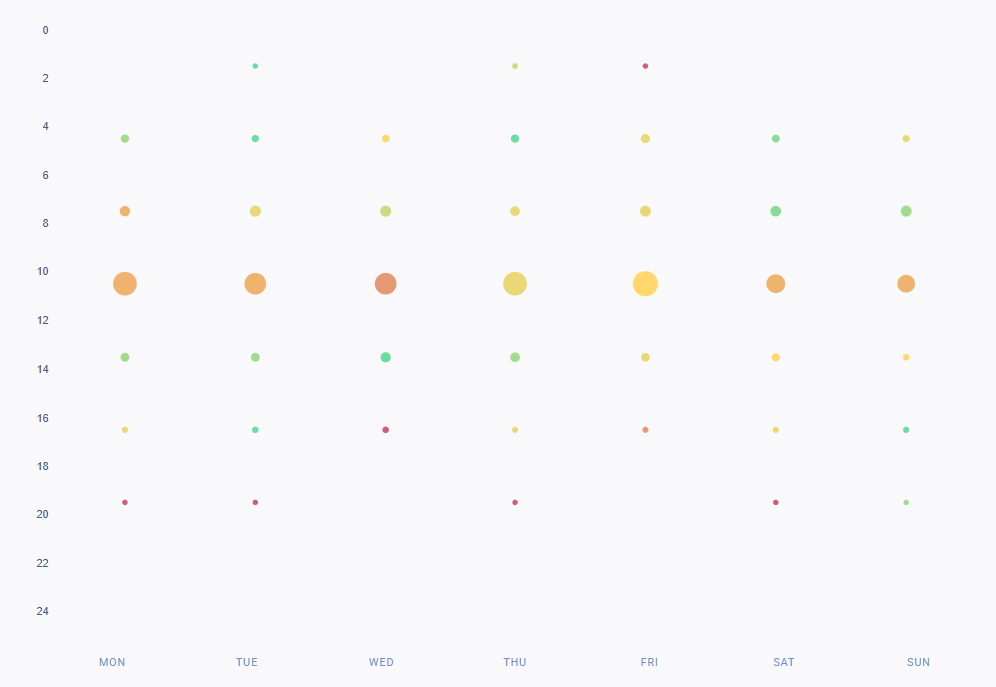
A social media analytics tool can help you identify time frames and days when engagement is highest. The chart below displays the frequency and the average post interaction rates for posts during a specific timeframe (green circles indicate higher post interaction rates, and larger circles represent more posts). In this case below, the ideal times for posting are Monday to Friday between 12:00 and 2:00 p.m. and Tuesday and Sunday between 4:00 and 6:00 p.m. These time windows reflect periods when the target audience is most responsive across competitor accounts, making them strong candidates for scheduling your own posts.
2. Research hashtags and keywords
In Instagram competitor analysis, hashtag and keyword research is not just about reach. It is about understanding how competing profiles successfully get discovered by the same audience you want to reach. Hashtags and keywords help Instagram categorize content and decide which posts are shown to which users. If you want to attract more users to your profile without relying on ads, you need to understand which hashtags consistently perform well within your niche.
The most effective way of doing this is through competitor-based keyword and hashtag research. Rather than guessing which hashtags “work,” you can analyze the hashtags and keywords your competitors use and see which ones are actually linked to stronger performance across accounts competing for the same audience.
With an Instagram analytics tool, you can build a strong dataset by combining your own data with competitor data to analyze:
- Which hashtags/keywords appear in competitors top-performing posts.
- The engagement rates that are correlated to specific hashtags/keywords across multiple accounts.
- Hashtags/keywords that seem popular but actually deliver weak interaction.
This matters because your competitors already show you what resonates with your shared audience. By analyzing their hashtag and keyword performance, you can:
- Identify the topics and tags that truly increase engagement in your niche.
- Spot trending hashtags early that bring engagement to your competitors.
- Avoid hashtags that attract low interaction.
- Build a targeted, data-backed hashtag strategy based on real results.
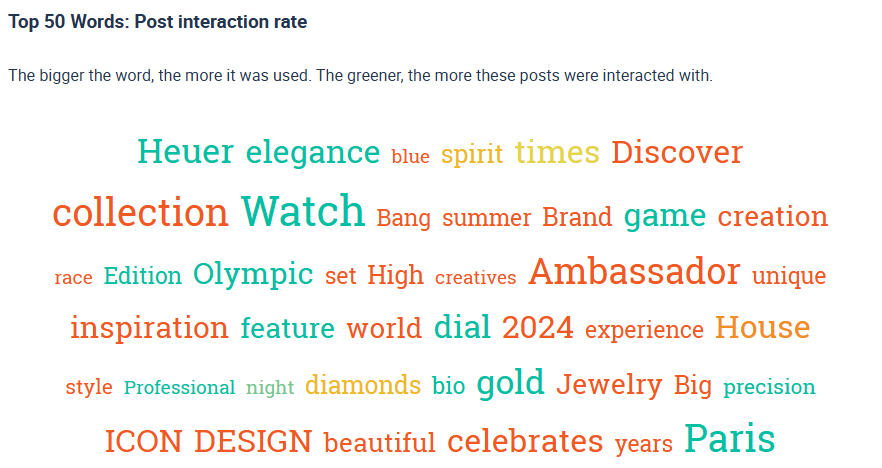
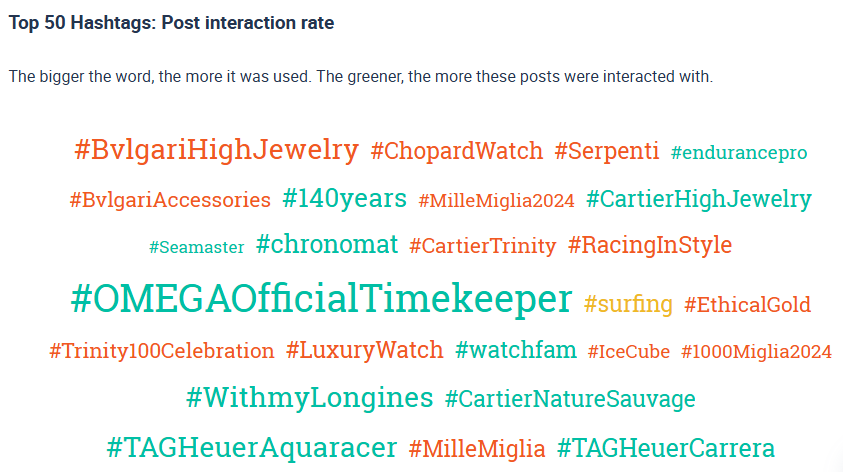
In our analysis of top watch brands, the combined hashtag and keyword clouds highlight these patterns clearly:
- Large, green tags such as #OMEGAOfficialTimekeeper indicate both high usage and strong engagement.
- Branded terms like #BvlgariHighJewelry, #TAGHeuerAquaracer, and keywords such as “watchfam” and “140years” also perform strongly.
- Big keywords and hashtags shown in orange or red appear frequently but correlate with lower interaction, showing which terms may be overused despite weaker results.
These insights allow you to refine your content strategy using competitor data as a filter. Instead of copying hashtags blindly, you focus on the tags and themes that consistently perform well for your shared audience and avoid those that do not.
3. Study the top content formats
The content format you choose is one of the most important factors on Instagram because it affects how your content is distributed, consumed, and engaged with. For example, a reel competes in a different environment than a carousel, and a single image behaves differently in the feed than a multi-slide post. This is why decisions about format have a direct impact on interactions, completion rates, saves, and even follower growth.
This is precisely why format analysis belongs in competitor analysis. If you only look at your own profile, you might react to a small sample size or a short-term performance spike. By analyzing formats across competitors in the same niche, you can determine what audiences are currently responding to and which formats consistently deliver results across multiple accounts.
A social media analytics tool allows you to compare the performance of different formats across competitors within a defined timeframe. The analysis typically looks at two things:
- Format distribution: shows how often each content format (e.g., pictures, carousels, reels) is used across competitor profiles. This helps you understand which formats competitors rely on most.
- Average post interaction rates by format: this calculates how each format performs in terms of interaction, regardless of how frequently it is used.
Combining these two views allows you to see if popular formats truly deliver stronger results or if less-used formats outperform expectations.
As you see from the charts below, carousels were the most commonly used format among the analyzed profiles in the summer of 2024 (June, July, and August). However, posts with pictures had a higher average post interaction rate than carousels or reels.
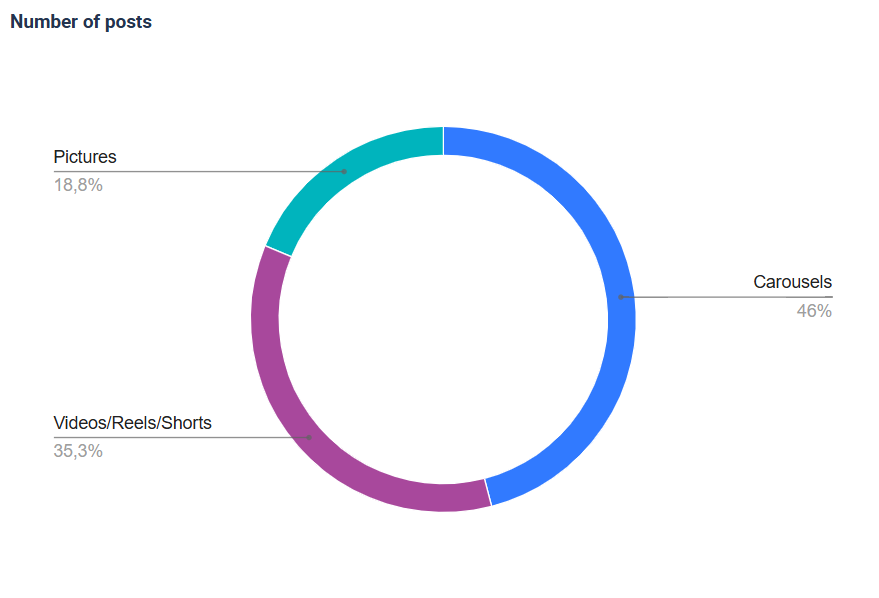
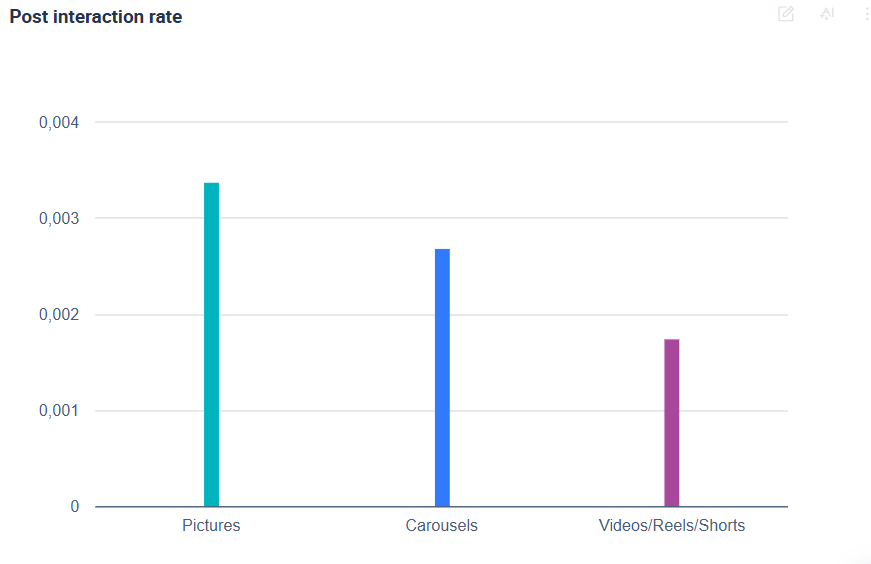
The main point is not “pictures always win.” The real takeaway is that within this niche and this timeframe, picture posts generated higher average interaction than carousels or reels across the competitor dataset.
4. Run a Tagging Analysis
A tagging analysis is one of the most powerful ways to understand why competitors’ posts perform the way they do. Instead of guessing what makes a post successful, you analyze your competitors’ content systematically and identify which post characteristics are consistently correlated with higher engagement across your niche. Tagging posts from competing profiles targeting the same audience allows you to move beyond isolated examples and uncover patterns across many accounts. This enables you to learn from successful strategies in your niche without relying on assumptions or trial and error on your own profile.
Tagging analysis turns competitor content into structured data. Instead of scrolling through posts and deciding what “looks good,” you label specific post attributes and compare how those attributes perform across your competitor dataset. This reveals which elements are actually driving engagement for your shared audience. Here is how to run a tagging analysis using competitor data:
- Define the attributes you want to analyze: these can include visual elements (product shown, number of people, close-up vs. lifestyle shot), caption elements, campaign themes, colors, tones, or simply the number of people in a post.
- Tag competitor posts accordingly: each tag is applied when a post includes that attribute.
- Compare engagement across tags: your analytics tool calculates whether posts with certain tags have higher or lower interaction rates.
- Identify meaningful correlations: this reveals patterns you would never spot manually.
The purpose of tags is to turn content choices into something you can actually measure. Each tag should represent a decision you could realistically make in your own content, such as what you show in a post, how it looks, or which angle you use. This way, a tagging analysis doesn’t just describe what happened but helps you decide what to post more (or less) of in the future.
Tags should represent clear, repeatable characteristics that help you break your competitor’s content into comparable groups. The goal is not to tag everything but to tag elements that could realistically influence how users react to a post. Common examples of tags include:
- Product shown: yes / no, or product category (e.g., “new launch,” “bestseller”). This helps you understand whether product-focused posts outperform other ones.
- People: none / 1 person / group, or “face visible” yes / no, to analyze if human presence correlates with a higher interaction rate.
- Campaign type: giveaway, collaboration, seasonal campaign, UGC, or announcement, to see which campaign formats consistently drive more engagement.
- Creative style: studio, lifestyle, before/after, meme, behind-the-scenes, to compare more authentic content with polished content.
- Content angle: educational, inspirational, entertaining, controversial, testimonial. This helps you identify which messaging styles resonate more with your competitor’s audience.
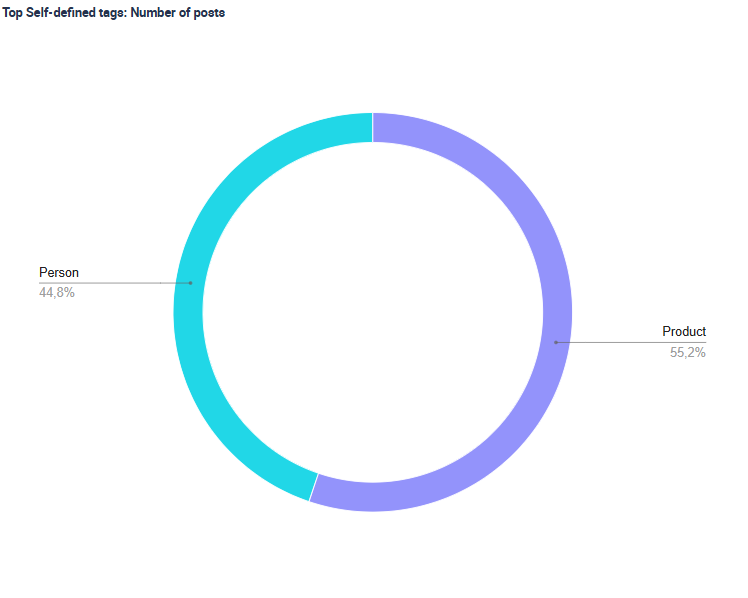
Below you see a simple example of a tagging analysis where competitor posts were tagged as either product-focused or people-focused. The first chart shows the distribution of the tags, meaning how often competitors post each type of content. In this case, posts featuring products and posts featuring people appear in similar proportions.
The second chart shows the average post interaction rate per tag. This is where the insights become actionable. Despite being used at a similar frequency, product-focused posts generate a higher average post interaction rate than posts featuring people.
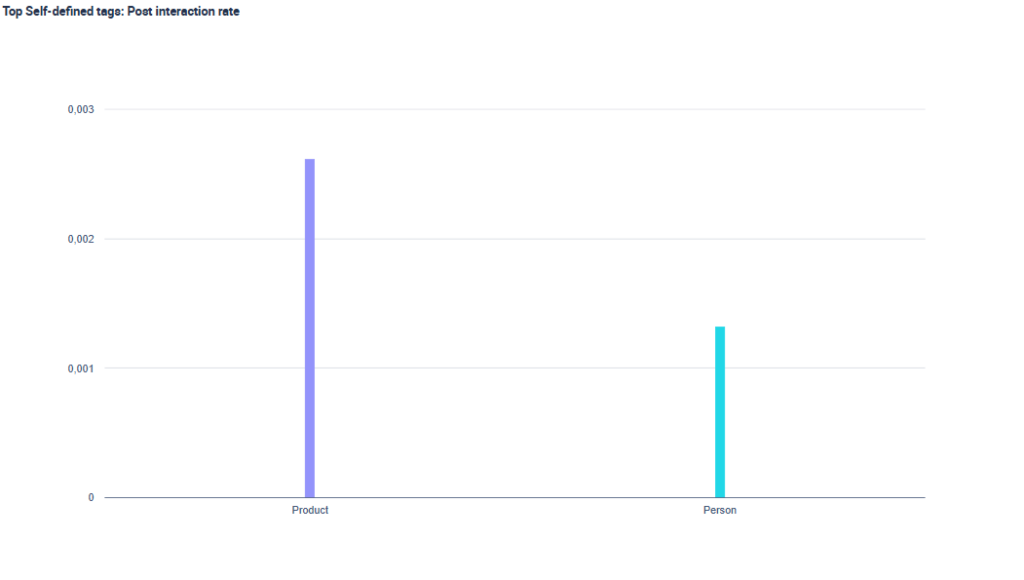
This type of comparison is exactly why tagging analysis is valuable in competitor analysis. It highlights gaps between what competitors publish most often and what actually performs best. Insights like these help you decide which content types to prioritize.
Step 5: Applying What You Learned
You now know how to benchmark competitors and spot content patterns. The difference between an analysis that looks impressive and one that improves results relies on turning these insights into actions. A concrete way to do that is to split execution into three action steps.
1) Integrate your insights into your strategy
Turn findings into clear rules and priorities, for example:
- Your 2 to 3 best posting windows (based on your dataset)
- The top formats to prioritize (and which formats are secondary)
- The content themes and hooks that consistently drive engagement
- Your hashtag and keyword clusters by topic (not random single tags)
2) Implement consistently (plan and publish)
Now translate those decisions into a publishing system:
- Build a content calendar around your best time slots
- Plan a format mix that matches what performed best (and include 1 to 2 controlled tests)
- Reuse proven hashtag sets and keyword framing where relevant
- Keep drafts, captions, assets, and approvals organized so execution stays consistent
Social media tools can help here, but the core is consistency: analysis only works if you apply it across multiple posts, not just once.
3) Monitor and improve (follow-up after posting)
Competitor analysis does not end once you publish your content. To gain valuable insights, you must continuously monitor your performance and compare it to that of your competitor benchmarks because audience behavior, algorithms, and trends change over time. After publishing, track whether your competitor-based insights hold on your own account:
- Review performance weekly against your benchmarks
- Check whether the “winning” formats and time slots still outperform
- Identify outliers (viral spikes, giveaways, paid pushes) so they don’t distort conclusions
- Update your strategy if patterns shift, especially seasonally or after platform changes
Competitor analysis should become a loop, not a one-time report. By regularly re-benchmarking your performance against similar accounts, you ensure that your strategy stays aligned with what actually works in your niche right now.
Finally, remember that growth is not just posting. Community management still matters: respond to comments, answer questions, and engage consistently, because interaction after publishing can amplify reach and strengthen loyalty.
Looking for an Instagram Competitor Analytics Tool
You can always begin by looking for a simple Instagram account analyzer that helps you quickly find out ways you can optimize your Instagram profile. These can be a great help to get you started and show you some basic things that you could be doing better. However, if you really want to take your Instagram activities to the next level, then finding a powerful social media tool that gives you the ability to analyze your competitors’ profiles while giving you actionable insights is a must.
When researching Instagram competitor analysis tools, remember that you would ideally be looking for one that excels in the various steps outlined above. Therefore, the best Instagram analytics tool would most likely include the following features:
- Unlimited profile tracking, which enables meaningfully large data sets
- Research features that allow you to discover other similar Instagram profiles
- Powerful benchmarking capabilities across dozens of metrics
- In-depth content analyses and insights to uncover optimization potentials
Moreover, if you are searching for the best Instagram analytics tool for all your activities on Instagram, keep in mind that many would likely be an “all-in-one” tool with community management and publishing features.
Conducting Your Own Instagram Competitor Analytics
Conducting competitive analyses on Instagram is greatly enhanced with a powerful tool that helps you find optimization opportunities while giving you an accurate comparison between your own and other similar Instagram profiles.
If you are looking for a tool like this, then you can try Fanpage Karma’s free 14-day trial. This is one of the best analytics tools for Instagram analyses since it gives you the ability to track and analyze an unlimited number of profiles. Remember, this is essential for building large enough data sets for the various benchmarking and content optimization insights you want to generate. Fanpage Karma is an all-in-one social media tool offering advanced benchmarking and content optimization insights along with community management, publishing, and research features.
There is also a free weekly webinar that shows you how you can improve the performance of your Instagram and other social media profiles.