US Midterm Elections 2026: Personal Attacks vs. Policy Criticism on Instagram
- Political Campaign Marketing Strategies: What Tagging Analysis Reveals
- How We Analyzed and Tagged Instagram Campaign Posts
- Criticism Appeared in Four Out of Ten Posts
- Personal Attacks Stood Out. Policy Criticism Did Not.
- Social Media and Politics: What Engagement Can and Can't Tell Us
- How to Run Your Own Tagging Analysis
Deep divisions over war and immigration, dissatisfaction with politics, and fears for the future of democracy form the backdrop to the US midterm elections on November 3, 2026. Looking at political campaigns on social media, we often get the impression that negativity dominates the conversation and that attacks focus more on individuals than on their policies. But facts don’t care about feelings, so we decided to test those impressions.
We examined 500 Instagram posts from the 2026 US midterm campaign to explore political campaign marketing strategies and their contribution to public discourse. Our focus was on the tone of the posts and the audience responses they attracted, without drawing general conclusions about political campaigning on social media.

Political Campaign Marketing Strategies: What Tagging Analysis Reveals
Tagging analysis begins with a clear question and a set of defined content categories. We assign each post a tag using consistent criteria, then analyze posts with the same tag as a group. This allows us to compare how frequently different content types appear and how their interaction rates differ. By turning qualitative content characteristics into quantifiable data, we can investigate how those features relate to user behavior and identify patterns in audience responses. For this analysis, we used that approach to explore the role of criticism in social media campaigns during the 2026 US midterms.
Negativity has always contributed to the news value of content, making the kinds of negativity we increasingly encounter on social media, particularly in politics, worth examining more closely. We therefore asked how often posts criticized opponents, what those attacks targeted, and how interaction rates compared across criticism types and posts without criticism.
How We Analyzed and Tagged Instagram Campaign Posts
We analyzed Instagram posts published from September 1 to October 20, 2026, by six politicians: three Democrats (Abdul El-Sayed, Jon Ossoff, and James Talarico) and three Republicans (Mike Rogers, Mike Collins, and Michael Whatley). Using Fanpage Karma analytics and self-defined tagging exports, we worked with a dataset of 500 posts, manually assigning each post to one of five mutually exclusive categories. The tags below provided a structure for analyzing the content:
- No criticism
- Attack on policy/governance
- Attack on character
- Attack on policy and character
- Other attack
How often politicians post is an especially interesting feature of this dataset and an important consideration when interpreting the results. Of the 500 exported posts, 72.2% came from Abdul El-Sayed and Mike Rogers. The dataset does not compensate for this uneven posting activity through weighting, so our findings should not be treated as general conclusions about political campaigning. Our focus on this intense phase of the campaign guided our decision to examine criticism categories rather than compare parties. We therefore use category-level interaction rates to explore how politicians campaign on social media during the 2026 US midterms. Posting frequency is a separate question, although it may indicate how much campaigning potential a candidate sees in social networks.
Criticism Appeared in Four Out of Ten Posts
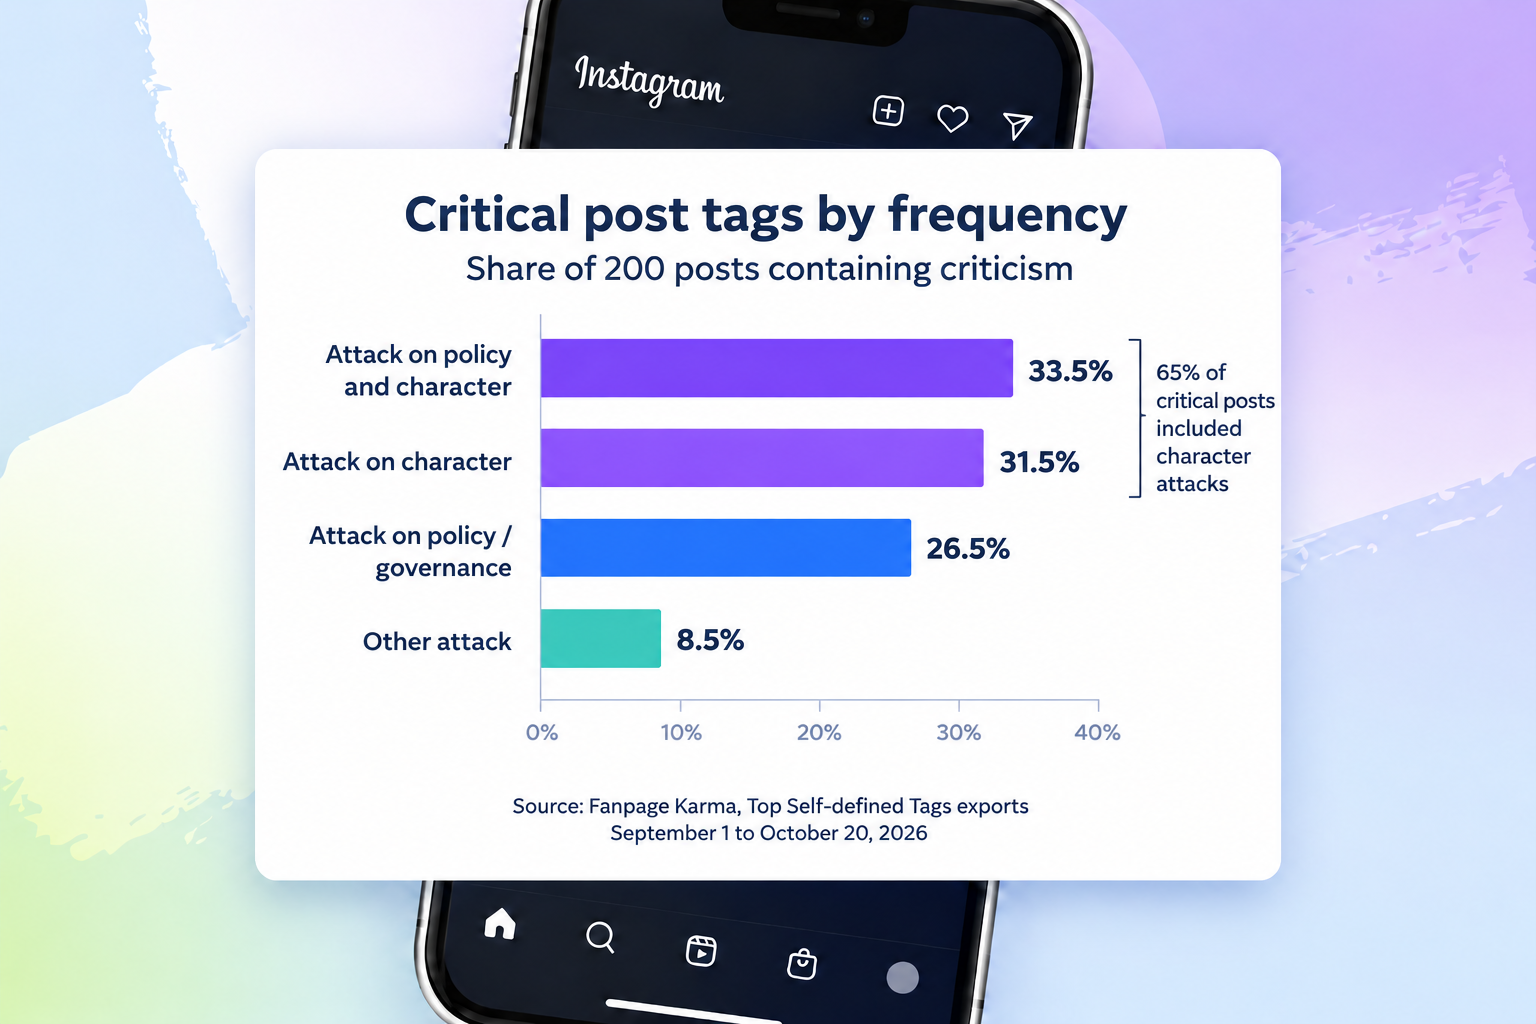
To investigate the use of social media in politics, we first established how many posts contained criticism and how many did not. Although negativity can seem to dominate political social media campaigns, most posts in our sample did not criticize an opponent. In our 500-post dataset, 200 posts contained political criticism, accounting for 40.1% of the sample, while the larger group of 299 posts (59.9%) contained none. Since we established different tagging groups, we can now compare different forms of criticism with posts that did not attack an opponent, rather than treating all criticism as a single type of content.
Character attacks appeared in 130 of the 200 critical posts, either exclusively or alongside policy criticism. That represents 65% of posts containing criticism, rather than 65% of the whole sample. The tags identify the target of the attack, not their overall emotional tone, and “no criticism” indicates no direct attack on a political opponent. Across all tagged posts, the distribution was:
• 59.9% contained no criticism.
• 13.4% attacked both policy and character.
• 12.6% attacked character only.
• 10.6% attacked policy or governance only.
• 3.4% contained other attacks.
Personal Attacks Stood Out. Policy Criticism Did Not.
Knowing how often politicians attack their opponents is only part of the picture. Political marketing strategies are adapted to what resonates with users or prompts stronger reactions, so we also need to examine engagement. To compare the five categories, we used posts without criticism as the baseline, allowing us to assess each type of attack against content that did not directly criticize an opponent. We treat the baseline interaction of rate as 1.00: values above it indicate higher rates, while values close to it indicate little difference. For example, 3.62 means an interaction rate 3.62 times that of posts without criticism. These comparisons concern rates, not raw interaction totals or percentage-point increases. Here is how the categories compared:
- No criticism (Baseline): 299 posts; reference category set to 1.00.
- Character-only attacks: 63 posts; 3.62 times the baseline interaction rate.
- Combined policy and character attacks: 67 posts; 1.86 times the baseline interaction rate.
- Other attacks: 17 posts; 1.19 times the baseline interaction rate.
- Policy or governance criticism only: 53 posts; 0.99 times the baseline interaction rate, almost unchanged.
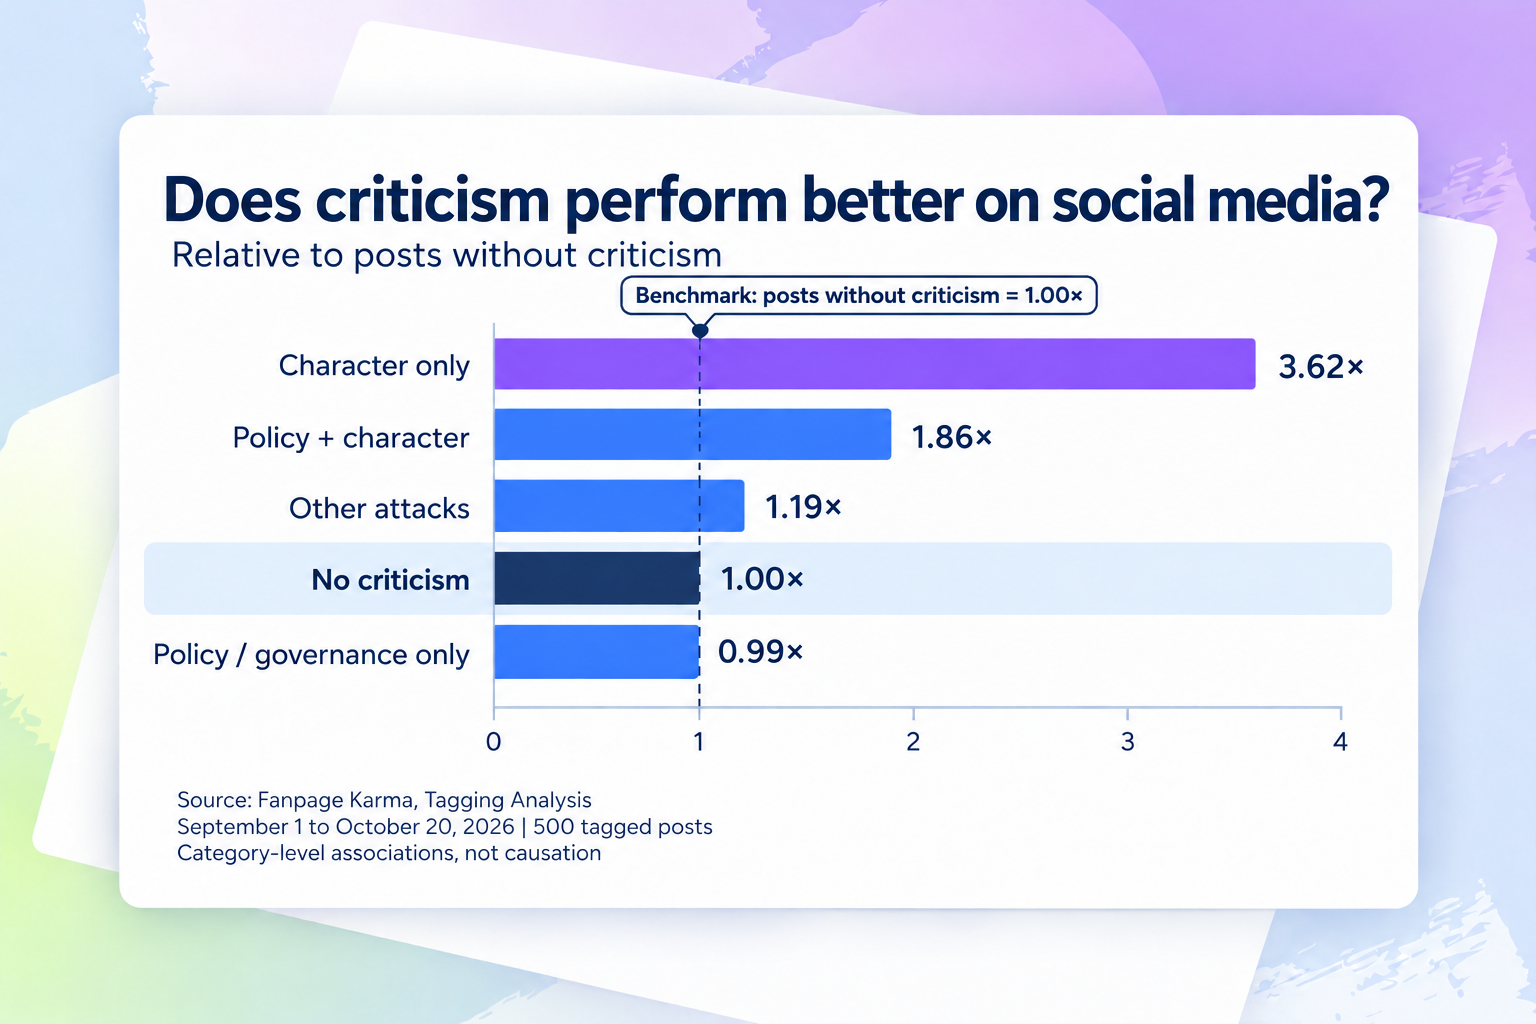
So, did criticism perform better in these political campaigns? For certain types, yes: character-only attacks had the highest interaction rate, and posts combining personal and policy attacks also outperformed the baseline of posts without any form of criticism, though by less. Policy-only criticism, however, remained close to posts without criticism, showing that criticism was not uniformly associated with stronger engagement. The clearest advantage appeared in personal attacks, often directed at perceived or alleged character flaws. Although this may not be entirely surprising, it is an important observation about political social media campaigns. The results apply to the combined sample without accounting for differences between individual accounts; they cannot establish that every politician’s audience responded in the same way or explain what caused the differences in interaction rates.
Social Media and Politics: What Engagement Can and Can’t Tell Us
Of course a higher engagement does not tell us whether a message won support. Reactions can express agreement, rejection, outrage, or interest in debate, and politicians may seek wider circulation for their message rather than only strengthening existing support. Character attacks can attract responses from their supporters and their opponents alike: some may endorse the criticism, while others challenge it. Even negative responses add to engagement and can increase exposure, reinforcing political group identities and the boundaries between supporters and opponents. This can amplify a message’s impact and stimulate participation without producing agreement.
US midterm elections have historically attracted lower voter turnout than presidential elections, making the motivation to participate particularly relevant to campaign communication. Reinforcing a sense of belonging to a political group may help turn existing support into a stronger intention to vote. Messages that sharpen the distinction between that group and its opponents can make participation feel more consequential, while also contributing to social media polarizing politics. This offers a possible explanation for the appeal of confrontational campaigning: it may activate supporters without persuading opponents.
How to Run Your Own Tagging Analysis
Our findings show why the categories you choose matter: broad labels can conceal differences between content types. You can apply the same approach to a question about your own posts, while keeping engagement separate from communication success. Follow these steps to structure your analysis:
- Set the scope: Choose a clear content question, the accounts you want to examine, and a defined publication period.
- Define and apply your tags: Give each category a clear meaning, then review the posts using the same criteria throughout. Use mutually exclusive categories if you want a breakdown like the one in this analysis.
- Compare the tag groups: Count the posts in each category and compare their interaction rates against a relevant reference group. Keep posting frequency separate from engagement performance.
- Interpret the results in context: Consider differences in account activity and assess engagement alongside sentiment, conversation quality, and communication goals. Treat associations as findings to investigate, not proof of causation.
Run your own tagging analysis with one clear question and a defined set of posts. Fanpage Karma’s self-defined tags can help structure the comparison; use the findings to guide your next content review. Interested in what a tagging analysis can do for you? Test Fanpage Karma for free and gain deeper insights into content performance and analytics.