How to Find the Right Social Media Post Types for Your Strategy

- The first trap: format is not the idea
- Pick the goal before the metric
- Clean data beats a clever chart
- Put publishing habits next to performance
- The average is only the beginning
- Turn the pattern into a real test
- One winning format is not the goal
- The mistakes that quietly ruin format analysis
- Your ideal social media Post type is a tested mix
Should your team publish more short videos, carousels, single images, text Posts, or links? Choosing the right types of content to post on social media sounds simple until every format produces a different signal. One attracts views, another earns saves, and a third brings comments from exactly the people you want to reach. Then one unusually successful Post lands in the report and suddenly everyone is ready to rebuild the content plan around it.
The way out is not another universal rule about the format that supposedly wins right now. It is a repeatable analysis that connects formats with objectives, compares them under fair conditions, looks closely at the Posts behind the averages, and turns promising findings into manageable tests. This workflow will help you decide which social media Post types deserve more space in your strategy without letting trends, habits, or one lucky result make the decision for you.

The first trap: format is not the idea
A post format describes how content is published, and the available formats vary by social network. For example:Instagram: Reels, carousels, single-image posts, Stories, and LiveFacebook: text posts, image posts, link posts, videos, Reels, Stories, and LiveTikTok: video posts, photo posts, text posts, Stories, and LiveLinkedIn: text posts, image posts, videos, document posts or carousels, polls, articles, and newslettersYouTube: standard videos, Shorts, live streams, and Community PostsPinterest: image Pins and video PinsX: text posts, image posts, videos, links, polls, and threadsA content angle, on the other hand, describes what the post communicates and how the topic is approached. A video can be educational, promotional, entertaining, or product-focused, just as a carousel can be used for a checklist, a tutorial, or a company update. The format is the publishing container, while the angle is the idea and perspective inside it.Keeping the two separate makes it easier to understand whether a result was driven by the format, the topic, the execution, or a combination of all three.
A short video can be a tutorial, reaction, interview, product demonstration, or behind the scenes story. A carousel might present a checklist, explain a process, summarize findings, or tell a visual story. The types of social media Post design can vary within the same format too. Even a single image can announce news, deliver a joke, share a quote, or show a product. If a tutorial video performs well, the result may be linked to the tutorial angle, the opening hook, the delivery, the subject, or the video format itself. Format analysis points you toward the right investigation. It does not explain the whole result on its own.
A social media analytics tool can filter Posts by format and provide a cleaner starting point than a collection of manual exports. Keep formats with very few Posts visible, since they may reveal an opportunity. Just treat their performance as an early signal rather than a settled conclusion. One carousel with excellent results is interesting. It is not yet enough evidence to declare carousels the new center of the strategy.
Pick the goal before the metric
There is no single KPI that can judge every Post format fairly. Metric tracking becomes useful only when it starts with a clear objective. First choose what the account or campaign needs to achieve. Then select the KPI that best represents that objective. Only after those two decisions should you compare the formats. A social media analytics tool can make the calculation faster, but it cannot decide what success means for your team.
The following connections are useful starting points, not rigid rules. The metrics available to you will also depend on the social network and your access level.
- Visibility: consider reach or views.
- Conversation: consider comments or a suitable interaction metric.
- Useful content: consider saves and shares where available.
- Traffic: consider link clicks or another click related metric.
- Video consumption: consider watch time, completion, or another relevant viewing metric.
This matters because the same format can look impressive under one KPI and ordinary under another. A video may collect plenty of views without generating clicks. A carousel with moderate reach may earn valuable saves from people who want to return to it. Before prioritizing either one, also ask whether it suits the audience, communicates the message naturally, fits the available budget and skills, and can be produced often enough to generate meaningful data. Choosing the format first and hunting for a flattering metric later turns analysis into decoration.
Clean data beats a clever chart
A polished dashboard can still give you a poor answer when the underlying comparison is inconsistent. Analyze one social network at a time, use the same timeframe for every profile included, and apply the same KPI definition across the data set. Each format also needs enough Posts to represent more than an isolated success or failure. There is no universal minimum, since the useful amount depends on publishing frequency, format use, and the length of the analysis period.
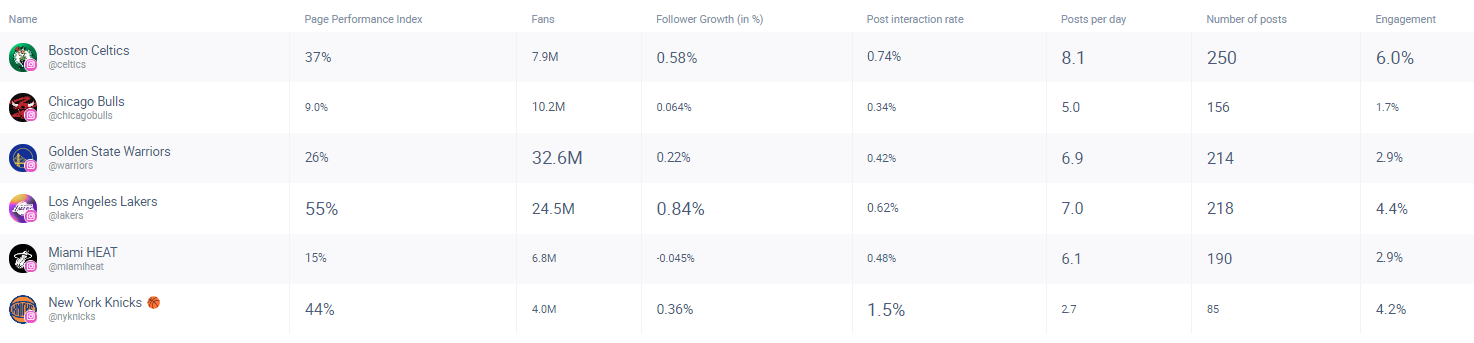
Relevant reference profiles can add context when they serve a similar audience or operate in the same niche and market. They help you see whether a pattern appears only on your account or across a wider content environment. Keep the comparison focused on the same network, period, and metric. An analytics view that brings the selected profiles and KPIs together is far more manageable than checking separate tabs and reports one by one.
The calendar needs attention too. Before accepting the result, check whether anything unusual shaped the selected period.
- Did a campaign or product launch dominate the results?
- Were important holidays or seasonal events included?
- Did one Post receive paid support or unusual distribution?
- Was one format reserved mainly for major announcements?
- Did the account change its publishing strategy during the period?
These factors do not make the data useless. They change what the data means. If video was used only for major launches, its performance cannot be separated from that role without looking more closely. The correct conclusion may be that launch videos perform well, not that every video will do the same.
Put publishing habits next to performance
Now comes the central comparison. Place format frequency beside format performance for the KPI you selected. One view should show how many Posts, or what share of Posts, appeared in each format. The second should show the average result for that KPI by format. A social media analytics tool can make this contrast visible quickly, revealing gaps that are easy to miss when a team looks only at its most common Post type.
Four broad patterns can emerge from this comparison.
- Frequently used and strong: the format has earned a stable role and may deserve continued investment.
- Frequently used and weak: the format may be overused, poorly executed, or connected to the wrong objective.
- Rarely used and strong: the format looks promising and deserves a structured test.
- Rarely used and weak: the format may be a lower priority, although sample size and execution still need checking.
Imagine that carousels make up only a small part of the content mix but generate strong save results. That could indicate an underused opportunity for educational content. If short videos are published most often but do not lead on the KPI that matters, their popularity in the content calendar should not be confused with effectiveness. These patterns give you hypotheses to investigate. They do not prove that the format alone produced the outcome.
The average is only the beginning
Format averages can hide completely different executions. One exceptional Post can lift the result of a format with a small sample, while a weak series can make a potentially useful format look worse than it is. Move from the chart to the actual Posts. In a social media tool metric views can be filtered by Post type, keyword, or individual metric, making it easier to inspect both the strongest and weakest content rather than celebrating only the winners.
Review Posts within the same format and ask questions that expose the creative choices behind the number.
- What topic did the Post cover?
- What happened in the opening seconds or on the first slide?
- Was the value clear immediately?
- Which visual and editorial style did it use?
- What tone did the Post take?
- Did it include a clear call to action?
- Was it connected to a campaign, launch, holiday, or current event?
- What do the strongest Posts in this format have in common?
Tagging adds another useful layer. Label Posts by attributes that matter to your business, such as topic, tone, content focus, hook, or call to action, then compare those labels within and across formats. This turns a mixed content archive into a structured data set and helps separate the publishing container from the idea and execution inside it.
Instead of concluding that carousels work best, you might discover that checklist carousels perform well while announcement carousels do not. That is a much more actionable finding. The next content plan can test the combination of format and angle rather than repeating every carousel and hoping for the same outcome.
Turn the pattern into a real test
A strong historical pattern or result from relevant reference profiles is not a finished strategy. It is a reason to test. Choose one promising opportunity, connect it to a clear objective and KPI, and plan enough Posts to evaluate a pattern rather than one attempt. Keep the conditions reasonably comparable so that a change in timing, subject, campaign support, or production quality does not overwhelm the format question.
A practical format test can follow this sequence.
- Select one format opportunity supported by the analysis.
- Write a clear hypothesis connected to one objective and KPI.
- Plan several Posts instead of relying on a single publication.
- Keep topic quality, timing, cadence, hook, and promotion as comparable as possible.
- Review the results with the same KPI and timeframe logic.
- Decide whether to adopt, adjust, test again, or pause the format.
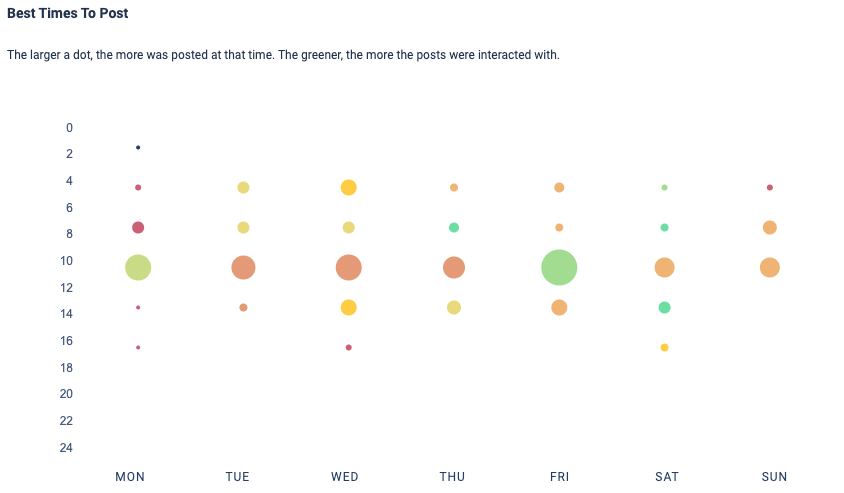
A scheduling tool can help the team prepare the test content in advance and maintain the planned timing and cadence. This reduces the risk that everyday workload determines when each Post goes live. It also makes the test easier to coordinate when several people are involved in creation, approval, and publishing.
Production capacity belongs in the evaluation. A format can perform well and still be a poor choice for frequent use if each Post requires more time, budget, or specialist support than the team can sustain. The aim is not to recreate one isolated hit. It is to identify a format and execution pattern that can deliver useful results repeatedly under realistic working conditions.
One winning format is not the goal
Your analysis does not need to crown one permanent winner. Several formats can support different jobs within the same strategy. One may be suited to broad visibility, another may encourage saves and shares, while a third supports conversation or traffic. A simpler format may also help the team maintain a reliable publishing rhythm between more demanding productions.
Give each selected format a clear role instead of expecting every format to serve every objective. The mix should fit audience behavior and remain manageable for the people who create, approve, and publish the content. Review it again after a meaningful analysis period, a major campaign, a noticeable performance change, or a shift in objectives or production capacity. A reusable analytics setup with consistent KPIs can make these reviews much faster and reduce manual reporting work.
The mistakes that quietly ruin format analysis
You do not need advanced statistics to run a useful format analysis. You do need to compare the right things and recognize what the data can and cannot show. Before turning any result into a decision, check for these common problems.
- Treating a content angle as if it were a Post format.
- Combining formats from different social networks as though they were identical.
- Using one universal metric for every objective.
- Drawing a conclusion from one unusually successful Post.
- Comparing profiles or formats across different timeframes.
- Ignoring campaigns, launches, holidays, and seasonal effects.
- Assuming the most frequently published format must be the best one.
- Copying a pattern from another profile without testing it on your own account.
- Looking only at format averages without reviewing individual Posts.
- Ignoring the time, skills, approval work, and budget required for regular production.
Treat this list as a quality check rather than a reason to avoid analysis. Social media teams rarely work with perfectly controlled conditions, but consistent choices make the findings far more useful. Keep the network, period, KPI, and objective aligned, then document the unusual factors that may have shaped the result.
Your ideal social media Post type is a tested mix
The ideal format is not automatically the newest, most popular, or most frequently published option. Separate format from angle, identify the formats available on each network, connect the objective to the right KPI, build a fair data set, and compare frequency with performance. Then inspect individual Posts, test promising combinations, and create a mix your team can sustain. Begin with one network and one meaningful analysis period to uncover the next format question worth testing. Put the workflow into practice by trying Fanpage Karma for free, then explore it further in our webinar.