Premier League Social Media Power Ranking: Arsenal Leads While Coventry Challenges the Follower Table

- First, the rules of the table
- Four reporting lessons behind the football
- The complete ranking data
- Instagram follower count ranking: Manchester United has the largest audience
- Instagram follower growth ranking: Coventry City sets the pace
- Instagram publishing ranking: Manchester City posts the most
- Instagram post interaction ranking: Coventry City leads the response table
- Overall Instagram ranking: Fulham takes first place
- TikTok follower count ranking: Tottenham has the largest audience
- TikTok follower growth ranking: Coventry City leads by a clear margin
- TikTok publishing ranking: Manchester United posts the most
- TikTok post interaction ranking: Coventry City takes first place
- Overall TikTok ranking: Arsenal comes out on top
- Arsenal wins without leading every column
- What could move by halfway?
- The opening verdict
Follower totals make social media comparisons look simple. Put the clubs with the biggest audiences at the top, sort the rest underneath, and call it a ranking. The trouble is that audience size says little about current growth, publishing activity or how strongly people respond to posts. Arsenal leads our opening Premier League social media power ranking, but Coventry City produces the result that really tests the usual assumptions about what a powerful account looks like.
Fanpage Karma analyzed all 20 clubs in the supplied dataset across Instagram and TikTok, covering 40 profiles in total. The period runs from May 25 to August 21, 2026, spanning the end of the 2025 to 2026 season and the opening of the 2026 to 2027 campaign. The ranking brings four different measures together and gives both platforms equal weight. So what changes when follower count no longer gets to decide the table on its own?

First, the rules of the table
The opening edition covers 89 days, with both the start and end date included. That timing captures several distinct phases in the football calendar: the closing stretch of one season, summer activity and the return of competitive matches. Results therefore describe performance during this defined window. They are not lifetime account scores or a judgment based only on opening weekend content.
Each club is ranked on four metrics for Instagram and the same four metrics for TikTok. Together, they cover audience size, momentum, activity and audience response:
- Follower count: The size of the club’s audience on August 21, 2026
- Follower growth rate: How the audience changed during the full analysis period
- Number of posts: How much content the club published during the 89 days
- Post interaction rate: How strongly the audience responded to the published content
The timing of these measurements is important. Follower count is a snapshot from August 21. Growth, posting activity and post interaction cover the entire period from May 25 to August 21. Keeping that distinction visible prevents a current audience total from being confused with movement across the period.
The calculation follows four steps. This makes the final score transparent and keeps Instagram and TikTok equally important:
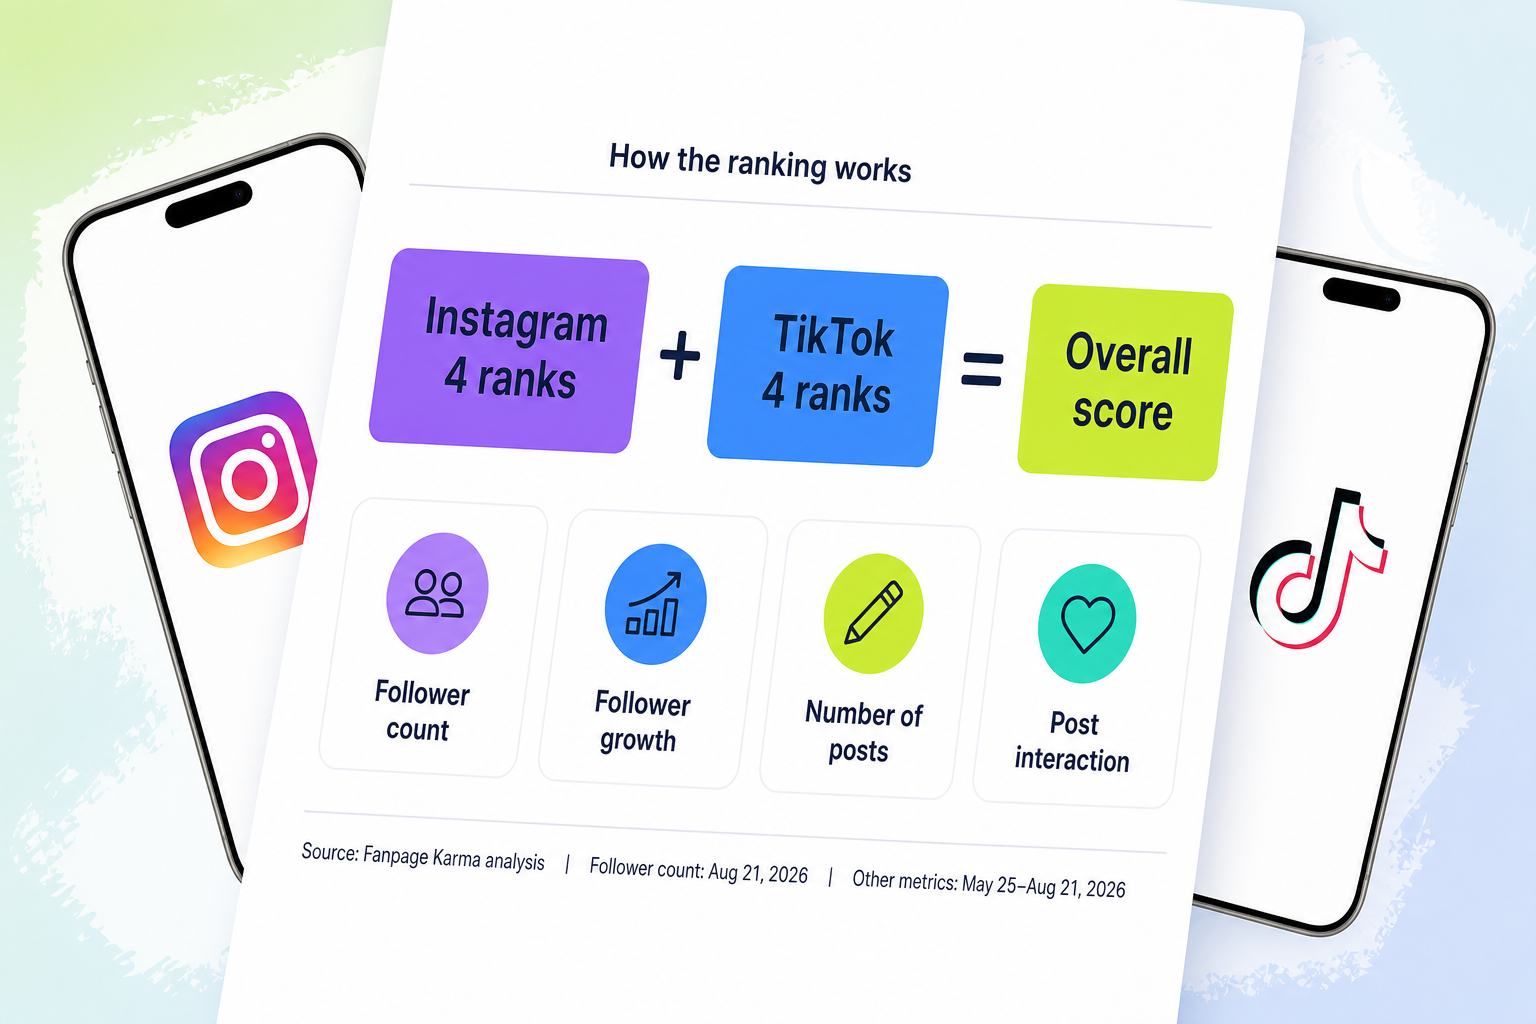
- Rank every club on the four Instagram metrics.
- Average those four ranks to create the Instagram score.
- Repeat the process for TikTok to create the TikTok score.
- Average all eight metric ranks to calculate the combined score.
A lower average rank is better. If a club places near the top across several metrics, its average falls and its position improves. Ties use the average of the affected ranking positions. Crystal Palace and Fulham, for example, share the same TikTok follower total and each receives a rank of 16.5 for that metric. This method stops one enormous raw figure from overpowering the rest of the analysis. A large following can help, but so can fast growth, consistent activity and strong post interaction.
Four reporting lessons behind the football
The ranking is built around football clubs, but the method applies to brands, agencies and social media teams managing several profiles. Its main value is not the final number alone. It is the structure that makes different parts of performance visible without forcing them into one vague idea of success.
Four principles can make regular social media reporting clearer and more useful:
- Keep audience size and current performance separate. Follower count shows scale, while growth and post interaction reveal what happened during the selected period.
- Review each platform before combining results. Instagram and TikTok can produce sharply different outcomes for the same account.
- Pair publishing volume with audience response. The number of posts measures activity, not whether those posts generated interaction.
- Make dates and weighting visible. Readers should know when follower totals were captured, which period the remaining metrics cover and how the final score was calculated.
A practical report can follow the same sequence as this ranking. Start with a fixed comparison group and a defined period. Apply identical metric definitions to every profile, review the platform results, then create a combined score only if it answers a useful business question. A cross platform analytics dashboard can make that process easier to manage, especially when teams would otherwise reconcile profiles and calculations manually.
Context should sit next to the score rather than in a separate footnote nobody reads. A negative growth figure, a tie or a difference in the precision of platform data can affect interpretation. Clear notes help social media managers explain why a profile moved without turning a single ranking position into a sweeping judgment about content quality.
The complete ranking data
The analysis above focuses on the most revealing results. The complete metric and platform rankings show how every club reached its final position.
Instagram follower count ranking: Manchester United has the largest audience
This Instagram follower count table ranks all 20 clubs by audience size on August 21, 2026, with Manchester United at the top and Coventry City at the other end of the ranking.
- Manchester United: 66,028,865
- Manchester City: 56,919,168
- Liverpool: 48,157,607
- Chelsea: 44,292,968
- Arsenal: 32,468,102
- Tottenham Hotspur: 16,961,827
- Aston Villa: 4,711,287
- Newcastle United: 3,738,014
- Everton: 3,366,275
- Crystal Palace: 2,361,242
- Brighton and Hove Albion: 2,107,441
- Fulham: 1,472,023
- Nottingham Forest: 1,423,083
- Sunderland: 1,411,399
- AFC Bournemouth: 1,369,720
- Leeds United: 1,362,278
- Brentford: 906,825
- Hull City: 705,651
- Ipswich Town: 679,089
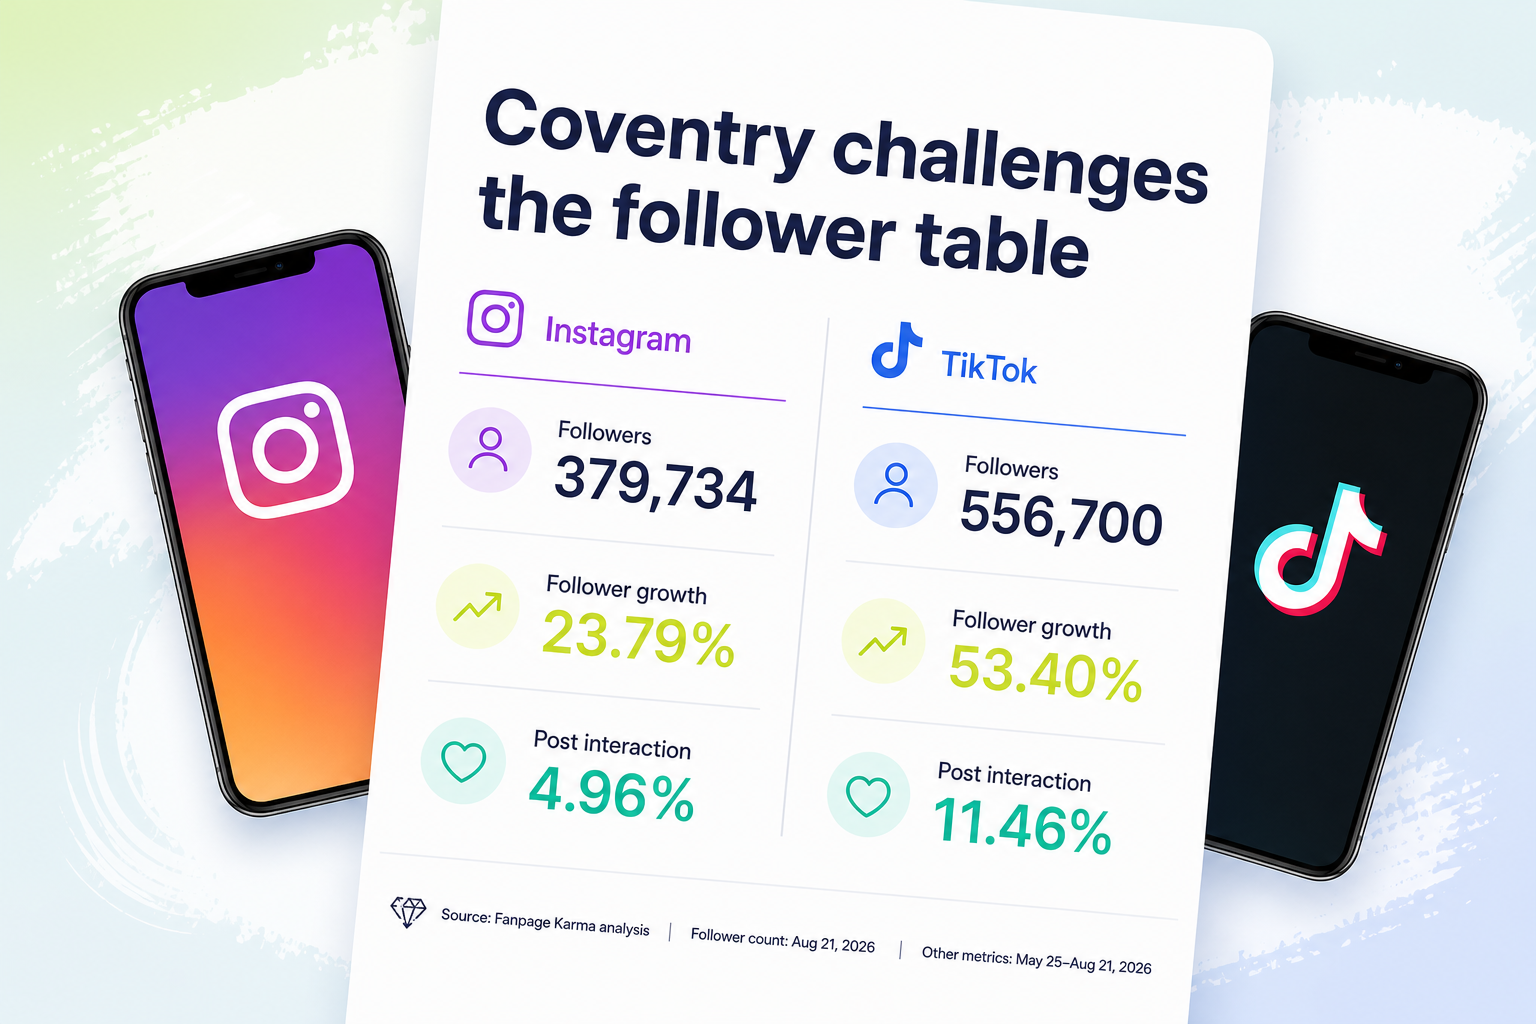
- Coventry City: 379,734
Instagram follower growth ranking: Coventry City sets the pace
This Instagram follower growth table shows how each club’s audience changed from May 25 to August 21, 2026, with Coventry City recording the highest growth rate and three clubs finishing the period with negative growth.
- Coventry City: 23.79%
- Ipswich Town: 8.33%
- Fulham: 8.10%
- Hull City: 7.63%
- Sunderland: 4.17%
- Aston Villa: 3.33%
- AFC Bournemouth: 2.88%
- Leeds United: 2.84%
- Crystal Palace: 2.22%
- Brentford: 1.69%
- Nottingham Forest: 1.62%
- Manchester City: 1.43%
- Newcastle United: 1.36%
- Arsenal: 1.20%
- Manchester United: 0.40%
- Chelsea: 0.31%
- Everton: 0.17%
- Tottenham Hotspur: −0.44%
- Liverpool: −0.65%
- Brighton and Hove Albion: −0.70%
Instagram publishing ranking: Manchester City posts the most
This Instagram number of posts table compares publishing activity across the 89 day analysis period, with Manchester City producing the most posts and Brentford the fewest.
- Manchester City: 1,174
- Tottenham Hotspur: 1,154
- Chelsea: 1,150
- Manchester United: 1,063
- Liverpool: 913
- Arsenal: 827
- Everton: 652
- Nottingham Forest: 647
- Crystal Palace: 605
- Sunderland: 555
- Aston Villa: 525
- Leeds United: 410
- Newcastle United: 409
- Brighton and Hove Albion: 405
- Fulham: 319
- Hull City: 301
- AFC Bournemouth: 299
- Coventry City: 271
- Ipswich Town: 261
- Brentford: 239
Instagram post interaction ranking: Coventry City leads the response table
This Instagram post interaction rate table compares how strongly audiences responded to club content during the analysis period, with Coventry City ranking first and Manchester City twentieth.
- Coventry City: 4.96%
- Fulham: 2.25%
- Ipswich Town: 1.81%
- Hull City: 1.22%
- AFC Bournemouth: 1.13%
- Newcastle United: 0.98%
- Sunderland: 0.97%
- Brentford: 0.90%
- Leeds United: 0.83%
- Brighton and Hove Albion: 0.74%
- Crystal Palace: 0.69%
- Aston Villa: 0.68%
- Nottingham Forest: 0.61%
- Arsenal: 0.37%
- Everton: 0.29%
- Liverpool: 0.28%
- Chelsea: 0.23%
- Manchester United: 0.19%
- Tottenham Hotspur: 0.17%
- Manchester City: 0.16%
Overall Instagram ranking: Fulham takes first place
This overall Instagram table averages each club’s ranks for follower count, follower growth, number of posts and post interaction rate, showing Fulham in first place and Brentford and Brighton and Hove Albion sharing nineteenth.
- Fulham: 8.00 average ranking position
- Manchester City: 8.75
- Aston Villa: 9.00, joint third
- Sunderland: 9.00, joint third
- Manchester United: 9.50
- Arsenal: 9.75, joint sixth
- Crystal Palace: 9.75, joint sixth
- Chelsea: 10.00, joint eighth
- Newcastle United: 10.00, joint eighth
- Coventry City: 10.00, joint eighth
- Hull City: 10.50
- Liverpool: 10.75, joint twelfth
- Ipswich Town: 10.75, joint twelfth
- AFC Bournemouth: 11.00
- Tottenham Hotspur: 11.25, joint fifteenth
- Leeds United: 11.25, joint fifteenth
- Nottingham Forest: 11.25, joint fifteenth
- Everton: 12.00
- Brentford: 13.75, joint nineteenth
- Brighton and Hove Albion: 13.75, joint nineteenth
TikTok follower count ranking: Tottenham has the largest audience
This TikTok follower count table ranks all 20 clubs by audience size on August 21, 2026, with Tottenham Hotspur leading at 43.9 million followers and Hull City ranking twentieth.
- Tottenham Hotspur: 43,900,000
- Manchester City: 37,100,000
- Manchester United: 33,800,000
- Liverpool: 29,600,000
- Chelsea: 23,000,000
- Arsenal: 13,800,000
- Newcastle United: 9,600,000
- Everton: 5,600,000
- Aston Villa: 5,100,000
- Brighton and Hove Albion: 3,400,000
- Nottingham Forest: 2,431,200
- Leeds United: 2,400,000
- Brentford: 2,300,000
- AFC Bournemouth: 2,200,000
- Sunderland: 1,900,000
- Crystal Palace: 1,700,000, joint sixteenth
- Fulham: 1,700,000, joint sixteenth
- Coventry City: 556,700
- Ipswich Town: 544,900
- Hull City: 540,400
Crystal Palace and Fulham each receive an average rank of 16.5 for the final score because they share the same follower total.
TikTok follower growth ranking: Coventry City leads by a clear margin
This TikTok follower growth table shows how each club’s audience changed during the analysis period, with Coventry City recording the highest rate and four clubs tied at 0%.
- Coventry City: 53.40%
- Nottingham Forest: 20.32%
- Fulham: 13.33%
- Ipswich Town: 9.46%
- Newcastle United: 9.09%
- Crystal Palace: 6.25%
- Everton: 5.66%
- Arsenal: 5.34%
- Hull City: 5.07%
- AFC Bournemouth: 4.76%
- Leeds United: 4.35%
- Aston Villa: 4.08%
- Chelsea: 3.14%
- Manchester City: 2.77%
- Manchester United: 2.11%
- Liverpool: 2.07%
- Tottenham Hotspur: 0%, joint seventeenth
- Sunderland: 0%, joint seventeenth
- Brentford: 0%, joint seventeenth
- Brighton and Hove Albion: 0%, joint seventeenth
The four clubs tied at 0% each receive an average rank of 18.5. These values should be interpreted carefully because many of the retrieved TikTok follower totals use coarse increments.
TikTok publishing ranking: Manchester United posts the most
This TikTok number of posts table compares club publishing activity across the 89 day period, with Manchester United narrowly ahead of Chelsea and Ipswich Town recording the lowest output.
- Manchester United: 285
- Chelsea: 283
- Liverpool: 265
- Manchester City: 254
- Everton: 251
- Newcastle United: 230
- Tottenham Hotspur: 200
- Arsenal: 178
- Nottingham Forest: 151
- Aston Villa: 128
- AFC Bournemouth: 125
- Brentford: 116
- Crystal Palace: 115
- Brighton and Hove Albion: 110
- Coventry City: 88
- Leeds United: 87
- Fulham: 80
- Sunderland: 69
- Hull City: 64
- Ipswich Town: 58
TikTok post interaction ranking: Coventry City takes first place
This TikTok post interaction rate table compares audience response to club content during the analysis period, with Coventry City leading at 11.46% and Tottenham Hotspur ranking twentieth.
- Coventry City: 11.46%
- Fulham: 4.00%
- Hull City: 3.09%
- Ipswich Town: 2.85%
- Crystal Palace: 1.40%
- Arsenal: 1.39%
- Aston Villa: 1.31%
- AFC Bournemouth: 0.98%
- Sunderland: 0.93%
- Leeds United: 0.91%
- Nottingham Forest: 0.74%
- Chelsea: 0.69%
- Brighton and Hove Albion: 0.62%
- Manchester City: 0.59%
- Manchester United: 0.56%
- Liverpool: 0.4375%
- Newcastle United: 0.4368%
- Brentford: 0.26%
- Everton: 0.23%
- Tottenham Hotspur: 0.098%
Overall TikTok ranking: Arsenal comes out on top
This overall TikTok table averages each club’s ranks for follower count, follower growth, number of posts and post interaction rate, showing Arsenal in first place and Brentford in twentieth.
- Arsenal: 7.00 average ranking position
- Chelsea: 8.00
- Nottingham Forest: 8.25
- Manchester City: 8.50, joint fourth
- Manchester United: 8.50, joint fourth
- Newcastle United: 8.75, joint sixth
- Coventry City: 8.75, joint sixth
- Aston Villa: 9.50
- Fulham: 9.63
- Liverpool: 9.75, joint tenth
- Everton: 9.75, joint tenth
- Crystal Palace: 10.13
- AFC Bournemouth: 10.75
- Tottenham Hotspur: 11.63
- Ipswich Town: 11.75
- Leeds United: 12.25
- Hull City: 12.75
- Brighton and Hove Albion: 13.88
- Sunderland: 15.13
- Brentford: 15.38
Arsenal wins without leading every column
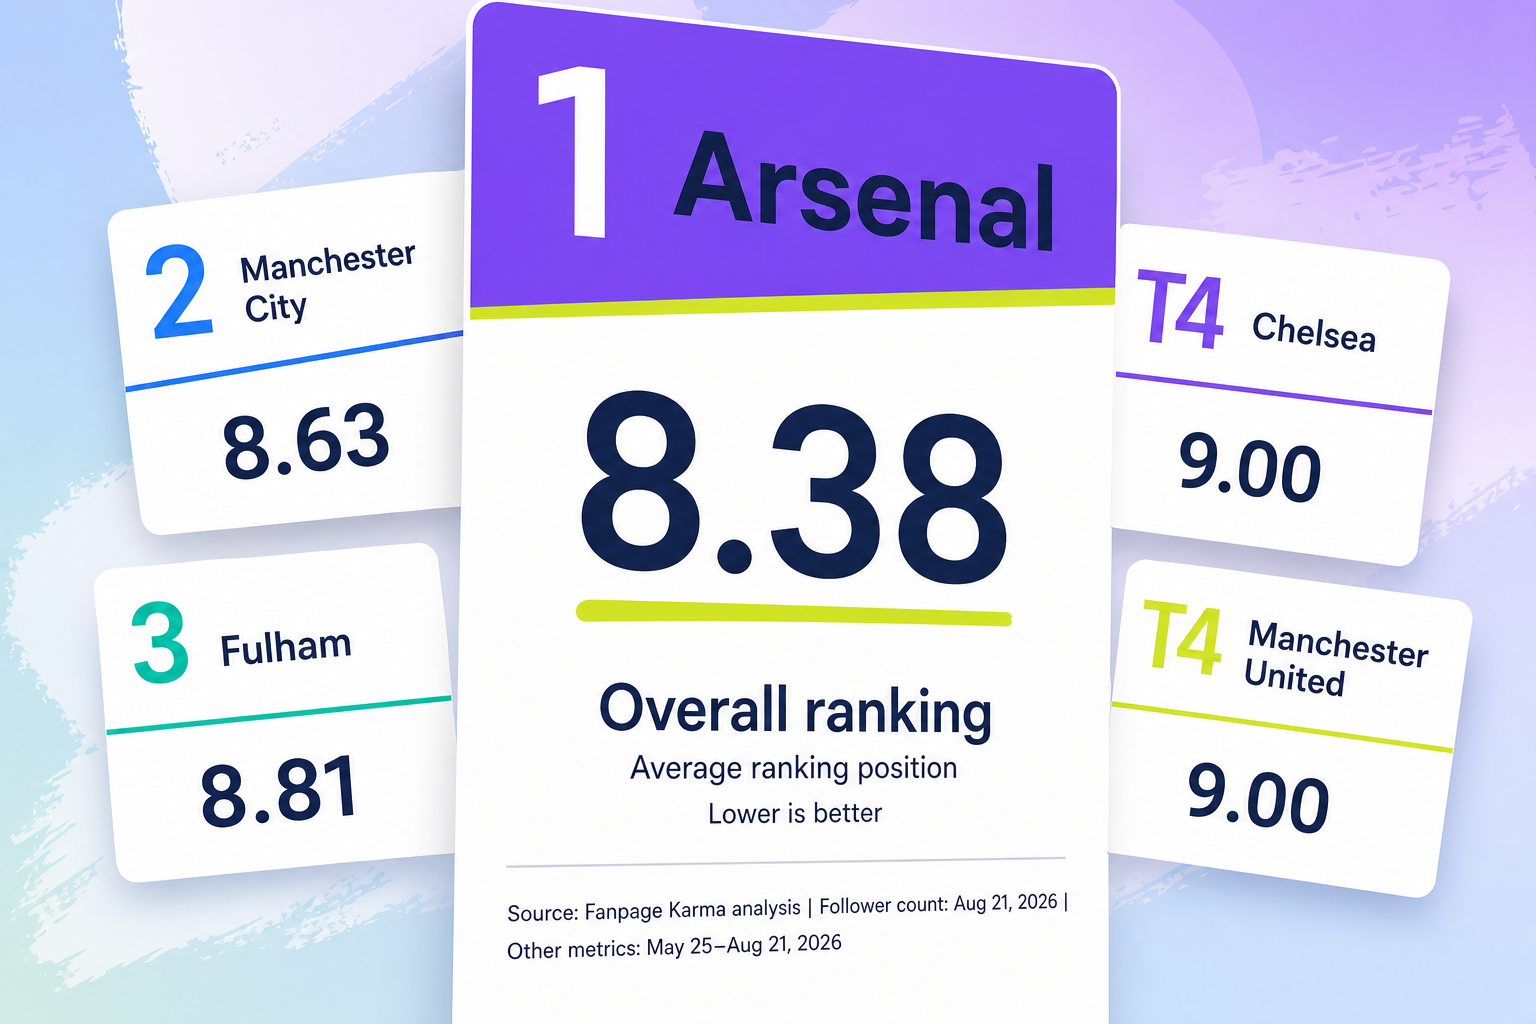
The leading group is extremely close. Only 0.62 ranking points separate first place from the two clubs sharing fourth. That narrow margin matters because it shows how contributions from all eight ranks shape the table. The opening top five are:
Arsenal reaches the summit through a solid Instagram result and the strongest TikTok score. It shares sixth place on Instagram with an average rank of 9.75, then takes first on TikTok with 7.00. Manchester City follows a different route, finishing second on Instagram and sharing fourth on TikTok. Fulham’s Instagram victory lifts it into third overall, while Chelsea and Manchester United arrive at exactly the same combined score from different platform results.
The next group remains competitive. Aston Villa places sixth with 9.25, followed by Newcastle United and Coventry City together on 9.38. Nottingham Forest takes ninth and Crystal Palace completes the top half. This is where the ranking begins to separate famous global scale from performance across the full metric mix.
This combined social media table gives equal weight to all eight Instagram and TikTok metric ranks, showing Arsenal in first place, a tie between Chelsea and Manchester United in fourth, and Brentford in twentieth.
- Arsenal: 8.38 average ranking position
- Manchester City: 8.63
- Fulham: 8.81
- Chelsea: 9.00, joint fourth
- Manchester United: 9.00, joint fourth
- Aston Villa: 9.25
- Newcastle United: 9.38, joint seventh
- Coventry City: 9.38, joint seventh
- Nottingham Forest: 9.75
- Crystal Palace: 9.94
- Liverpool: 10.25
- Everton: 10.88, joint twelfth
- AFC Bournemouth: 10.88, joint twelfth
- Ipswich Town: 11.25
- Tottenham Hotspur: 11.44
- Hull City: 11.63
- Leeds United: 11.75
- Sunderland: 12.06
- Brighton and Hove Albion: 13.81
- Brentford: 14.56
What could move by halfway?
This is the opening ranking, not the final whistle. Fanpage Karma is scheduled to update the analysis at the halfway point of the 2026 to 2027 season and again after the season ends. Repeating the same method will show which early results persist and which change as the measurement window expands.
The halfway edition will give five storylines a fresh set of numbers:
- Can Arsenal hold the overall lead and remain first on TikTok?
- Will Fulham retain its Instagram lead?
- Can Coventry City sustain its follower growth and post interaction results?
- Will Sunderland close the gap between its Instagram and TikTok scores?
- Can Brighton and Hove Albion and Brentford improve their combined positions over a longer period?
Those questions are deliberately open. The current data establishes a starting point rather than predicting what comes next. Using the same metrics and weighting at each update will make the comparison meaningful.
The opening verdict
Arsenal leads the opening combined ranking, Fulham wins Instagram and Arsenal takes first place on TikTok. Manchester City reaches second overall despite ranking last for Instagram post interaction. Coventry City, meanwhile, rises to joint seventh by leading follower growth and post interaction on both platforms, even with one of the smallest combined audiences in the dataset.
The lesson for social media professionals is straightforward. Follower count, growth, publishing activity and post interaction answer different questions, and the platform view matters as much as the combined result. Use the same four perspectives when reviewing your own profiles, and follow Fanpage Karma for the halfway update and the final 2026 to 2027 Premier League social media power ranking.