New Instagram Insights update: 6 metrics and signals to watch
Instagram analytics used to feel simple. A post got likes. A Reel got views. A profile gained a few visits. Helpful at first glance, but often not enough to explain what actually happened.
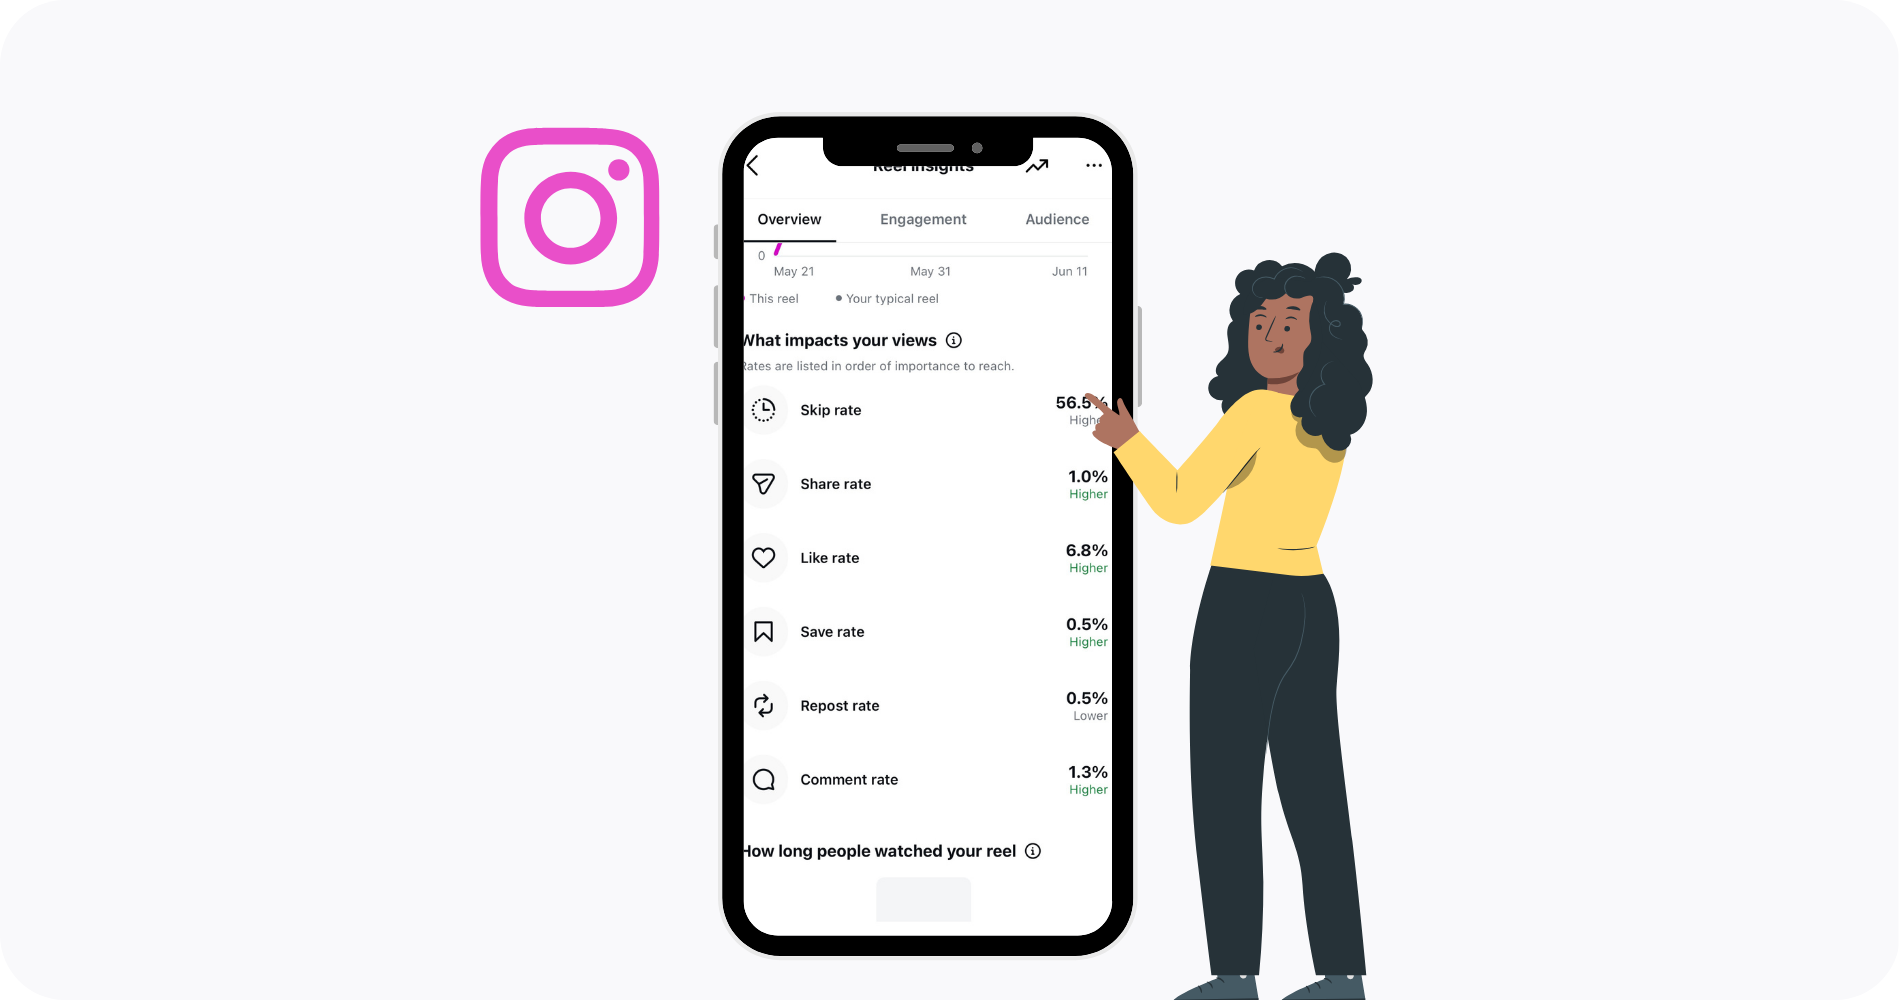
That is where the new Instagram Insights update gets interesting. The focus moves closer to what creators really need to know: Did people stay, share, save, repost, comment or leave? This article dives into six key metrics that you should pay attention to: Reels skip rate, repost rate, save rate, share rate, like rate and comment rate.

The real update is not more data. It is better clues.
The big problem with many social media reports is not a lack of numbers. It is a lack of answers. A Reel can reach people, but did it hold attention? A post can get views, but did anyone care enough to share, save, repost, like or comment?
That is why the Instagram Insights update is interesting. It appears to move Instagram Insights from simple performance reporting toward clearer reach analysis. Put simply, it could help creators see what helped content travel and where it lost people.
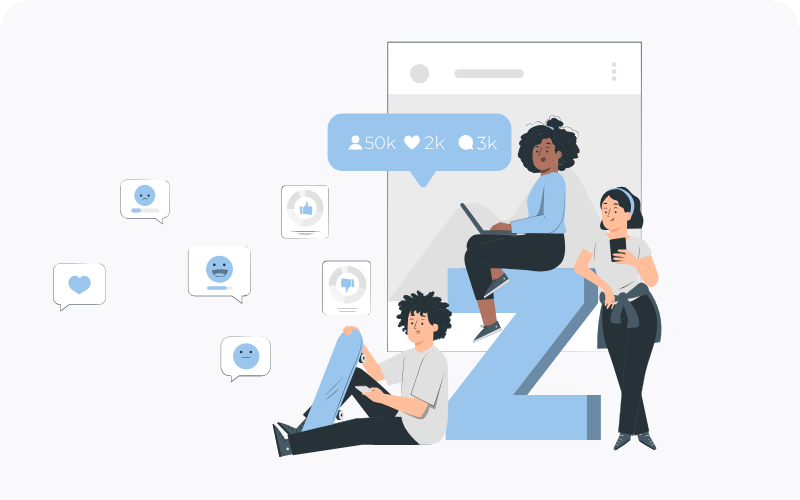
Views, likes and comments still matter. They show visible reactions. But rate-based and behavior-based signals can add another layer. They can show whether people stayed, shared, saved, reposted, liked, commented or left after watching.
The 6 new Instagram Insights metrics at a glance
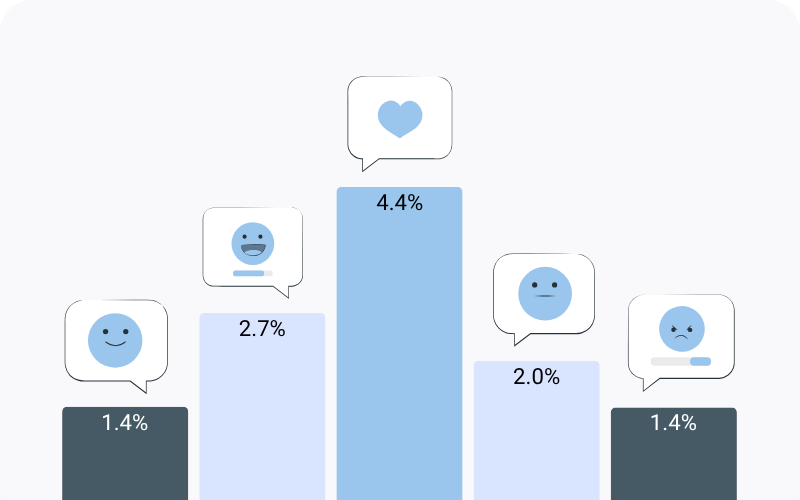
Not every metric tells the same story. Some show whether people reacted in the moment. Others show whether they found the content useful, worth sharing or easy to skip. Here are the six new Instagram metrics to keep on your radar:
- Comment rate
- Skip rate
- Share rate
- Like rate
- Save rate
- Repost rate
Skip rate can expose weak openings
Skip rate shows the percentage of views from people who skipped during the first 3 seconds of your Reel. It is calculated by dividing the number of views that skipped in those first 3 seconds by the number of initial views. An initial view starts when your Reel begins to play for the first time in a Reel session.
That makes skip rate a very practical signal in the update. It can help identify whether the start of a Reel is losing people before the idea has time to land. Reels can lose attention fast. The opening seconds can decide whether many viewers stay or leave. If the hook is weak, the rest of the Reel may never get a chance.
High skips may suggest that the topic is unclear. The first frame may not create enough curiosity. The caption or on-screen text may also promise something that the video does not deliver quickly enough. To avoid a high Reels skip rate:
- Start with the outcome or problem.
- Make the first frame easy to understand.
- Avoid long intros.
- Match the visual hook with the caption.
- Test different openings for the same topic.
A skip is not always a failure. Some content is simply not for everyone. The better question is whether the right audience leaves too early.
Share rate tells you if people recommend your content
Share rate shows how much of your reached audience turned into shares. In other words, it connects sharing activity with the people your content actually reached. Shares can happen in different ways, including Story, DM or another platform.
The value is easy to understand. A like can be quick. A share takes more intent. A DM share is especially meaningful because someone actively sends the post or Reel to another person, which can help the content move beyond the first audience.
That makes share rate a useful clue for content resonance. It can help separate content people simply watched from content people actively passed on. For creators and brands, that difference is important.
To improve share rate, think about content people would naturally send to someone else. Would your audience share it with friends, colleagues or family? Relatable jokes, useful tips, clear explainers, local events and timely news can all give people a reason to pass content on.
The safest way to use share rate is to compare similar content within the same account. Compare Reels with Reels. Compare posts with posts. This keeps the reading cleaner and avoids false conclusions.
Like rate shows quick approval
Like rate shows how many viewers react with a like compared with the people who saw the post. It is usually a lighter signal than a share, save or comment, but it still helps you understand what your existing audience responds to. If you want to improve it, focus on content that feels instantly clear, relevant or relatable. Posts that match your audience’s interests are more likely to earn quick approval.
Save rate shows long-term value
Save rate shows how much of your reached audience saved your content. It is calculated by comparing saves with reach. A save can signal real value because the post was useful beyond the first scroll, not just entertaining in the moment.
This is especially helpful for educational posts, recipes, lists, checklists, tutorials, and how-to content. If the idea is something people might normally screenshot, it is a strong candidate for a saveable post.
The best use is comparison. Look at which topics, formats and hooks earn saves more often. Those patterns can help you plan content that people do not just view, but actually want to keep.
Repost rate shows when people pass content on
Repost rate shows how much of your reached audience turned into reposts. It helps you see when people pass your content on more visibly, which can put your post in front of audiences beyond your own followers.
That makes the repost rate different from a quiet reaction. When someone reposts your content, they publicly attach themselves to it. It can be a sign that the post feels relevant, relatable or worth being associated with.
To improve repost rate, ask yourself what your audience would feel comfortable putting in front of their own followers. Content with a clear opinion, a memorable line, a relatable situation or a format that fits their identity can make reposting feel more natural. Read it together with the share rate to see which ideas travel beyond the first viewer.
Comment rate shows conversation
Comment rate can show whether content starts a conversation. A comment usually takes more effort than a like, so it can be a useful signal for topics that invite opinions, questions or discussion.
Comment rate is most useful when you look at the quality of the conversation. Are people asking questions, adding opinions, or tagging others because the topic matters to them? That can show which ideas invite real discussion and which ones only get a quick reaction.
How to read these Instagram Insights metrics together
The real value of these metrics appears when you combine them. One number rarely explains the full story. A Reel with a high skip rate may have a weak opening, but if the people who stay also share or save it, the idea may still be strong. A post with many likes may look successful, but a low save rate or share rate can show that the reaction was quick rather than meaningful.
Use the metrics as a set of clues:
- High skip rate plus low share rate can point to a weak hook or unclear topic.
- Low skip rate plus high share rate can suggest that the Reel holds attention and feels worth passing on.
- High save rate plus low comment rate may mean the content is useful, but not very conversation-driven.
- High comment rate plus low share rate can show that the topic creates discussion, but may not be something people want to send or repost.
- High repost rate plus high share rate can point to content that strongly travels beyond the first audience.
- High like rate plus low save rate may show quick approval, but limited long-term value.
This makes the analysis more practical. Instead of asking whether a post was simply “good” or “bad”, you can ask what kind of response it created. Did people stay? Did they react? Did they save it? Did they pass it on? Each answer points to a different content decision.
Turn Instagram metrics into clearer reporting
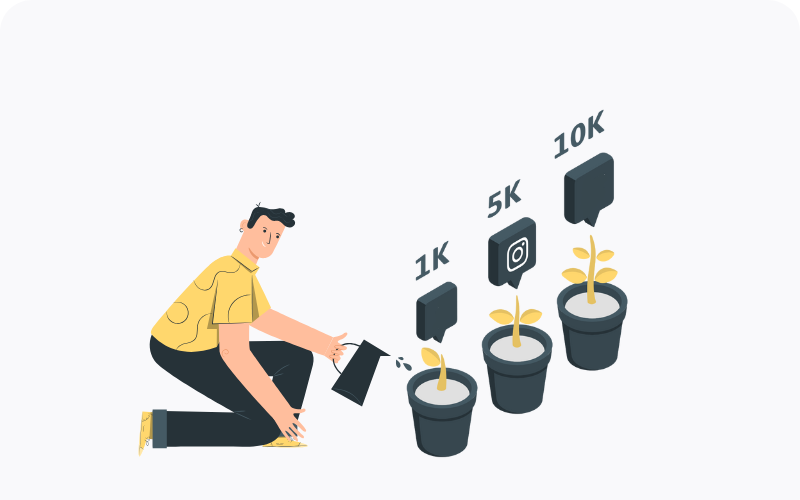
When you manage one profile, checking Instagram Insights manually can work for a while. But the more posts, Reels, campaigns and accounts you handle, the harder it becomes to keep the bigger picture clear. A social media analytics tool such as Fanpage Karma helps teams bring social media analysis into one regular workflow.
A structured analytics setup makes it easier to follow social media performance over time, compare content results and organize reporting across profiles. This helps teams move beyond single-post checks and see which formats, topics, and campaigns repeatedly create stronger reactions.
With a social media analytics tool, you can track metrics such as skip rate, share rate, save rate, repost rate, like rate, and comment rate over time. Instead of asking whether one post looked good on its own, you can compare patterns across similar content and see what actually changes from post to post.
- Spot content that regularly gets shared or reposted.
- Find formats that people save for later.
- Compare Reels, posts and campaigns more cleanly.
- Share clearer reports with your team or clients.
- Turn recurring patterns into better content decisions.
The goal is not to collect more numbers for the sake of it. It is to make the numbers easier to read, easier to compare and easier to act on.
Conclusion: Better reach starts with clearer analysis
The Instagram Insights update points toward more behavior-based analytics. The most useful reading comes from connecting several signals, not from looking at one number alone.
Reels skip rate can reveal weak hooks and opening problems. Share rate and repost rate show whether people actively pass content on. Save rate helps spot content people may want to return to.
Like rate can show quick approval. Comment rate can show conversation. Read these metrics together with content type, audience and goal before making decisions.
The smartest move is not to chase every new metric. It is to connect the right metrics to clear content questions and make the next post better than the last one.
If you want to keep this process organized across profiles, Fanpage Karma can help you track social media performance, compare content results, and turn analysis into a regular workflow. This makes it easier to spot patterns, share learnings with your team, and make clearer decisions for your next posts.
You can try Fanpage Karma free for 14 days to see for yourself how these new Instagram Insights metrics are performing across your profiles. You can also join a Fanpage Karma webinar to learn how to manage social media profiles with the tool.